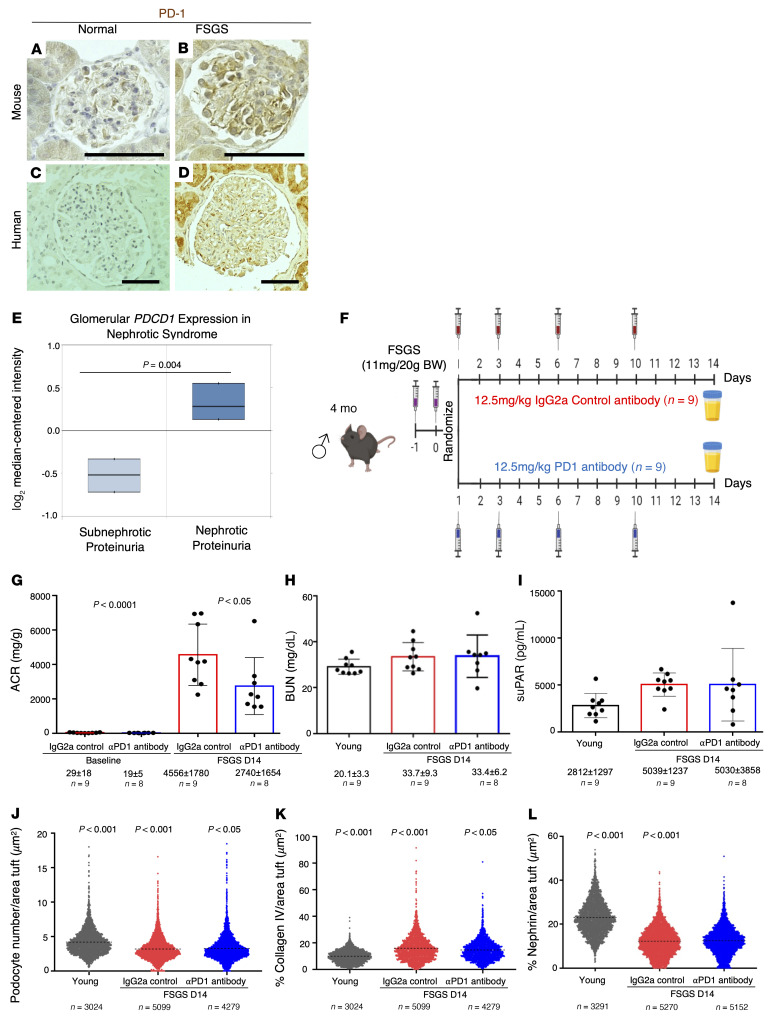
Figure 11. Anti–PD-1 antibody improves experimental FSGS.
(A–D) PD-1 immunoperoxidase staining (brown) of glomeruli from normal young mice (A) is increased in young mice with experimental FSGS (B). Similarly, in humans, PD-1 staining of glomeruli of a young human kidney (C) is increased in podocytes, PECs, and tubular epithelial cells of a kidney from an FSGS patient (D). Scale bars represent 50 μm. (E) Analysis of the Nephroseq data from NEPTUNE shows that PDCD1 mRNA levels in human microdissected glomeruli are significantly higher in patients with nephrotic-range versus sub-nephrotic-range proteinuria (n = 38). (F) To study PD-1 signaling in FSGS, 4-month-old mice were injected twice i.p. with a sheep anti-glomerular antibody. Mice were randomized into 2 groups, which received either an anti–PD-1 antibody (n = 8) or the isotype control IgG2a (n = 7) on days 1, 3, 6, and 10 after FSGS induction. (G–I) At the conclusion of the experiment, kidney function analyses showed that albumin/creatinine ratio (ACR) values significantly increased following FSGS induction in IgG2a control–injected but were reduced in aPD1ab-injected mice (G). Blood urea nitrogen (BUN) levels were not significantly different between the groups (H), while plasma soluble urokinase plasminogen activator receptor (suPAR) levels were significantly increased in FSGS mice injected with control IgG2a compared with young mice but were not reduced in mice injected with aPD1ab (I). (J) Quantification of podocyte density was lower in FSGS mice injected with IgG2a compared with young mice and was increased upon aPD1ab injection. (K) Glomerular scarring measured by glomerular collagen IV staining was higher in FSGS mice injected with IgG2a compared with young mice and was lowered by aPD1ab injection. (L) Nephrin immunostaining was lower in FSGS mice injected with IgG2a compared with young mice but was not significantly changed by aPD1ab injection. Each circle in J–L represents an individual glomerulus, and the number of glomeruli quantified is indicated. Statistical analysis was performed by t test.

