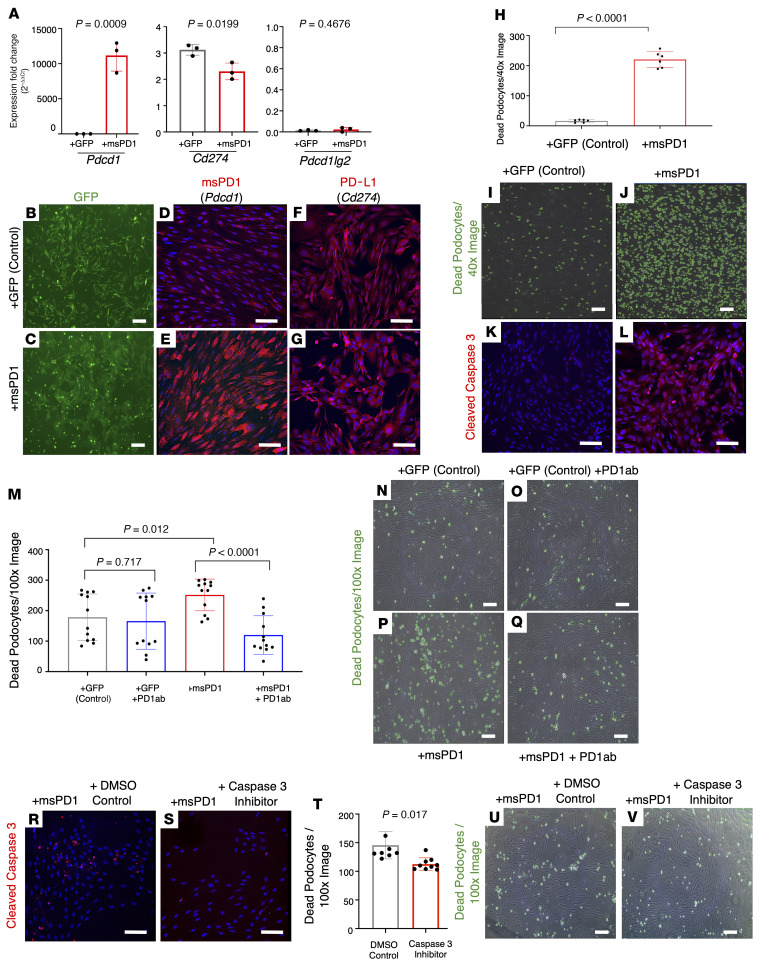
Figure 2. Overexpression of PD-1 induces podocyte death in cell culture.
(A–G) Following overexpression of PD-1 using a lentiviral expression vector (msPD1, red bars) in immortalized mouse podocytes, mRNA levels increased significantly for Pdcd1 (PD-1) in comparison with GFP control–infected podocytes, without changes to Cd274 or Pdcd1lg2. GFP expression (green) of the GFP control (B) and PD-1–overexpressing (C) lentiviral vectors confirms efficient transfection. Immunocytochemistry for PD-1 protein (red) in GFP control–infected podocytes (D) was increased in msPD1-overexpressing podocytes (E). DAPI stains nuclei blue. Staining for PD-L1 (red) was not different between GFP control–infected (F) and PD-1–overexpressing (G) podocytes. (H–L) Overexpression of PD-1 (red bar) increased podocyte death in comparison with GFP control–infected podocytes (gray bar). Representative images of dead podocytes (I and J). Cleaved caspase-3 staining (red) was barely detected in GFP control–infected podocytes (K) but was markedly increased in PD-1–overexpressing podocytes (L). Nuclei were counterstained with DAPI (blue). (M–Q) Application of aPD1ab (blue bar, second column) did not impact cell death in GFP control–infected podocytes (gray bar). The increased podocyte death induced by overexpression of PD-1 (red bar) was reduced when anti–PD-1 antibody was applied (blue bar, fourth column). (N–Q) Representative images of dead podocytes encircled with green annotations used for M. (R and S) Immunocytochemistry for cleaved caspase-3 (red) was increased in PD-1–overexpressing podocytes treated with DMSO (R) but was markedly decreased following treatment with the caspase-3–specific inhibitor Z-DEVD-FMK (S). (T–V) Treatment of PD-1–overexpressing podocytes with the caspase-3 inhibitor significantly decreased podocyte death (red bar) compared with the DMSO control (gray bar). (U and V) Representative images of dead podocytes encircled with green annotations in DMSO-treated (U) and caspase-3 inhibitor–treated (V) PD-1–overexpressing podocytes. Statistical analysis was performed by t test. Scale bars represent 100 μm.

