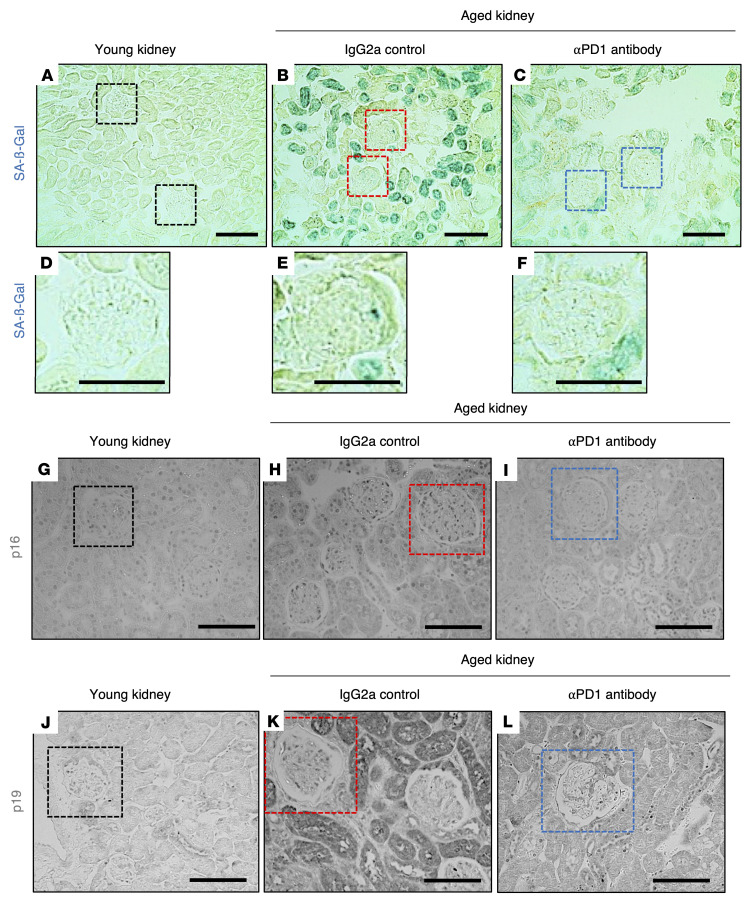
Figure 3. Podocyte senescence.
(A–F) Representative images of SA-β-gal staining (blue). SA-β-gal was barely detected in young kidneys (A and D) but increased in glomeruli (red boxes) and tubular epithelial cells in IgG2a-injected aged mice (B and E) and was lowered by aPD1ab in glomeruli (blue boxes) and tubules (C and F). (G–I) p16 staining (black) was occasionally detected in glomeruli and tubular epithelial cells of young kidneys (G). It was increased in glomerular (red box) and tubular epithelial cells in IgG2a-injected mice (H) but was lower in aPD1ab-injected mice (I). (J–L) p19 staining (black) was barely detected in young kidneys (J) but was increased in glomerular (red box) and tubular epithelial cells in IgG2a-injected mice (K) and was lower in aPD1ab-injected mice (L). Scale bars: 50 μm.

