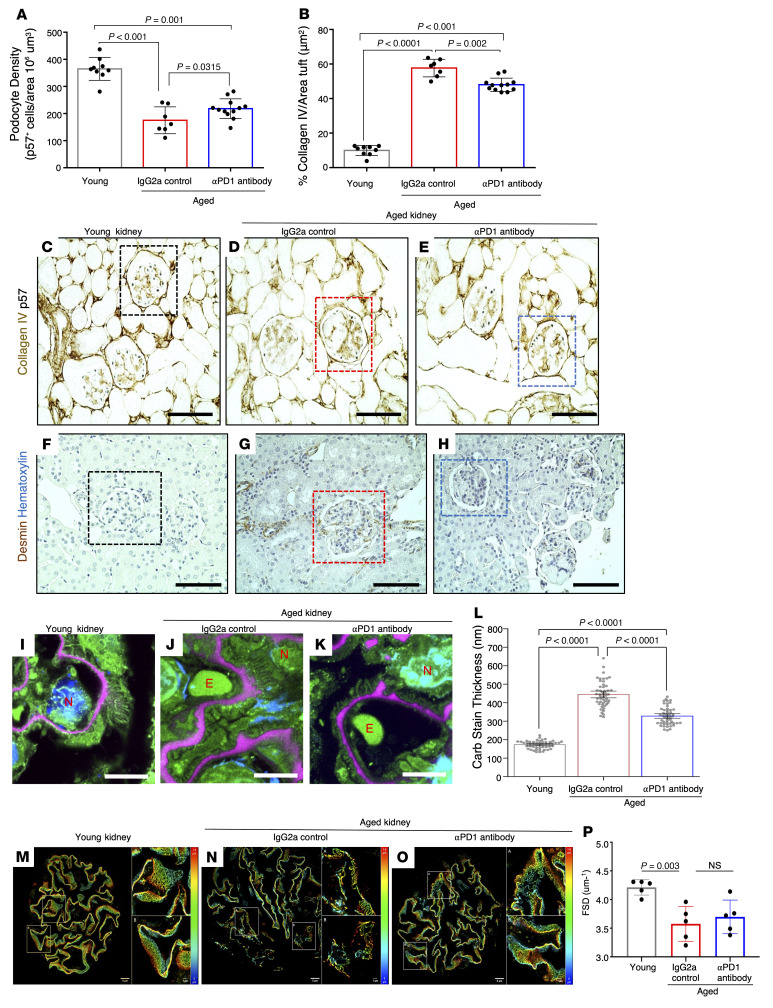
Figure 4. Podocyte density, scarring, stress, and ultrastructure.
(A–E) Podocyte density measured by p57 staining (dark blue, C–E) and summarized in A. Each circle represents an individual mouse. Density was lower in aged IgG2a-injected mice compared with young mice and was increased in aged aPD1ab-injected mice. Glomerular scarring was measured by glomerular collagen IV staining (brown, C–E) and is summarized in B. It was higher in IgG2a-injected aged mice compared with young mice and was lowered by aPD1ab. (F–H) The podocyte stress marker desmin (brown) was increased in aged IgG2a-injected mice compared with young and was lower in aged aPD1ab mice. (I–L) The filtration barrier ultrastructure was assessed by expansion microscopy of FLARE-labeled glomeruli, which demonstrated that glomerular basement membrane (GBM) thickness (pink) was significantly increased in aged IgG2a-injected mice (J) compared with young mice (I) and reduced in aged aPD1ab mice (K). Representative images are shown in I–K, and GBM thickness is quantified in L. N, nuclei; E, erythrocytes. (M–P) Podocyte ultrastructure was characterized by the podocyte exact morphology measurement procedure (PEMP). Representative images are shown in M–O, and filtration slit density (FSD) is quantified in P. This analysis shows a significant decrease in FSD in aged IgG2a-injected mice compared with young mice (M, N, and P). Elevation of FSD was observed in aged aPD1ab mice but did not reach significance (O and P). Scale bars: 5 μm (M–O), 10 μm (I–K), and 50 μm (C–H). Statistical analysis was performed by 1-way ANOVA.

