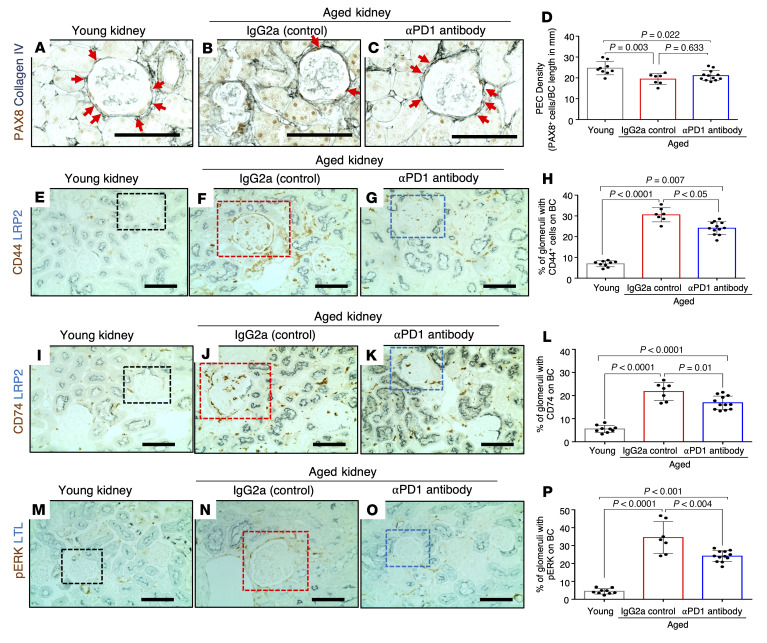
Figure 5. Parietal epithelial cell changes.
(A–D) Representative images of immunoperoxidase staining for the PEC marker PAX8 (brown) and collagen IV (blue, outlines Bowman’s capsule [BC]) (A–C) and quantification thereof (D). PEC density was lower in aged IgG2a-injected mice (red bar) compared with young mice (gray bar) but did not change with aPD1ab treatment (blue bar). (E–P) Representative images of immunoperoxidase double staining with antibodies against the PEC activation markers CD44 (E–G, brown), CD74 (I–K, brown), and p-ERK (M–O, brown) counterstained with the proximal tubular cell markers LRP2 (E–G and I–K, blue) and LTL (M–O, blue). Quantification (H, L, and P) shows that all 3 PEC activation markers were elevated in aged IgG2a-injected mice (red bars) compared with young mice (gray bars) and lowered by aPD1ab injections (blue bars). Scale bars represent 50 μm. Statistical analysis was performed by t test.

