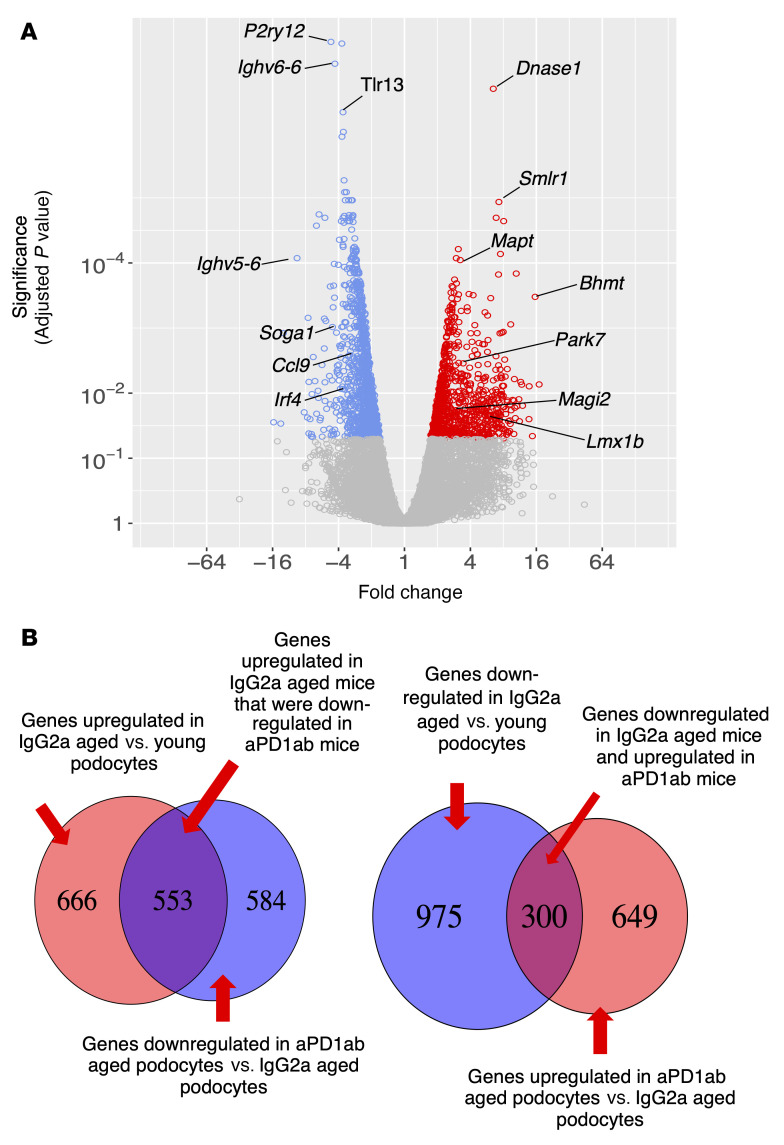
Figure 7. Podocyte transcripts in aged mouse podocytes altered by anti–PD-1 antibody.
(A) Volcano plot shows the transcripts in aged podocytes that were decreased (blue circles), increased (red circles), or not changed (gray circles) by treatment of mice with aPD1ab for 8 weeks. (B) Summary of the number of genes upregulated and downregulated in podocytes from aged control IgG2a mice compared with young mice, and from aged aPD1ab-injected mice compared with age-matched IgG2a-injected mice.

