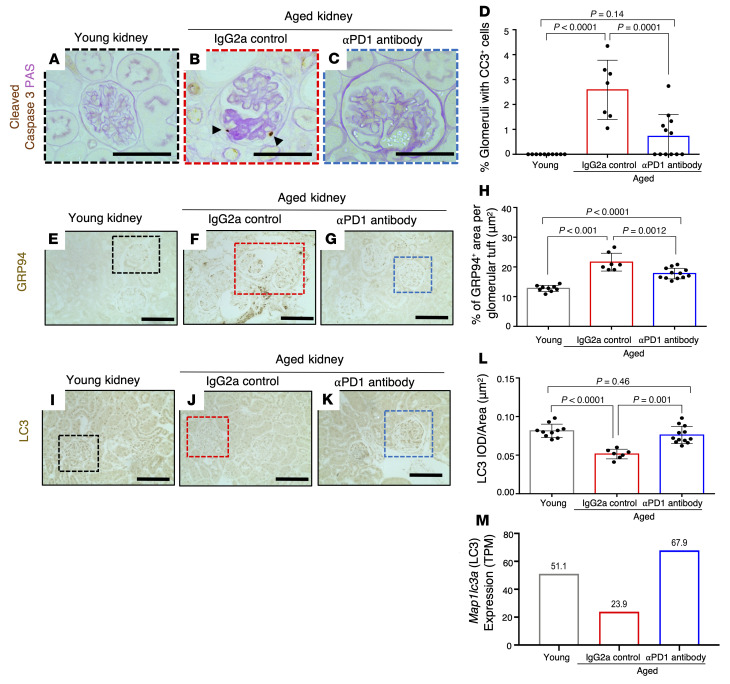
Figure 9. Apoptosis, ER stress, and autophagy.
(A–D) Representative images of immunoperoxidase staining for the apoptosis marker cleaved caspase-3 (brown) and periodic acid counterstain (pink). Glomerular apoptotic cells in aged IgG2a-injected mice are indicated by black arrowheads (B). Quantification of the percentage of glomeruli with at least a single cleaved caspase-3–positive (CC3+) cell (D) shows an increase in aged IgG2a-injected mice (red bar) compared with young mice (gray bar) and a decrease with aPD1ab treatment (blue bar). (E–H) Representative images of immunoperoxidase staining for the ER stress marker GRP94 (brown) and quantification thereof. GRP94 shows higher staining in aged IgG2a-injected mice (red bar), which was lowered upon aPD1ab treatment (blue bar). Individual mice are represented by circles. (I–M) Measurement of autophagic activity measured by LC3. Representative images of immunoperoxidase staining for microtubule-associated protein 1 light chain 3 (LC3) (I–K, brown) and quantification of the staining (L). Compared with young mice (gray bar), LC3 staining was lower in IgG2a-injected mice (red bar), indicating reduced autophagy, but was higher with aPD1ab treatment (blue bar). IOD, integrated optical density. (M) mRNA-Seq data from isolated podocytes showed a decrease in the Map1lc3a (LC3) transcript in IgG2a-injected mice (red bar) compared with young mice (gray bar) but an increase with aPD1ab treatment (blue bar). Scale bars: 50 μm. Statistical analysis was performed by t test.

