. 2022 Aug 12;11:e71591. doi: 10.7554/eLife.71591

Figure 2. Hepatocyte-like cells (HLCs) and primary human hepatocytes (PHHs) display transcriptomic differences associated with their state of maturation.

(A) Immunofluorescence staining of Albumin (yellow) and HNF4A (red) in HLCs differentiated for 30 days. Nuclei were counterstained with DAPI (blue). Scale bar, 100 µm. (B) CYP3A4 activity levels normalised per cell number (millions) in HLCs differentiated for 30 days (n=6) and PHHs (n=4). Bars represent mean with SD, and individual datapoints represent the different biological replicates. Statistical difference was calculated with unpaired t-test. (C) Principal component analysis (PCA) of undifferentiated human induced pluripotent stem cells (hiPSCs), HLCs derived from human embryonic stem cell (hESC) (hESC_HLCs) and hiPSC (hiPSC_HLCs), freshly harvested PHHs (fPHHs), or plated PHHs (pPHHs). (D) Heatmap showing the proportion of genes differentially expressed in each cell type (cluster 1 – PHHs, cluster 2 – HLCs, cluster 4 – hiPSCs) as well as in Heps (HLCs and PHHs) against undifferentiated hiPSCs (cluster 3). (E, F) Dotplot showing the top 15 hits on gene ontology enrichment analysis on genes associated to cluster 1 and cluster 3 as shown in (D). The size of each dot represents number of genes associated to each term and the colours represents the adjusted p-value. (G) Heatmap showing the differential gene expression of transcription factors between PHHs (fresh or plated) and HLCs (hESC and hiPSC derived). (H) Reactome pathway enrichment analysis on transcription factors identified in (G). Differential gene expression was calculated with log2(fold change) higher than 2 and adjusted p-value <0.05. Hierarchical clustering on samples was generated by Euclidean distance.

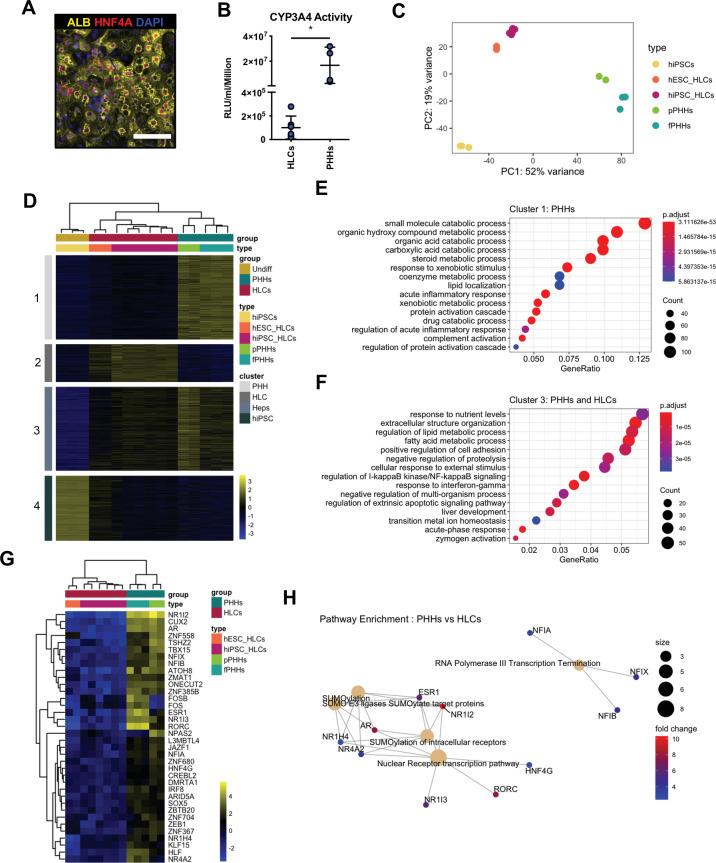
Figure 2—source data 1. Individual measurements and statistical tests related to Figure 2 and corresponding supplements.
Figure 2—source data 2. List of genes differentially expressed in the four clusters in Figure 2D.
elife-71591-fig2-data2.xlsx (125.9KB, xlsx)

Figure 2.

Figure 2—figure supplement 1. Characterisation of transcriptional differences between hepatocyte-like cells (HLCs) and primary human hepatocytes (PHHs).

Figure 2—figure supplement 1.

(A) mRNA levels measured by qPCR throughout 30 days of human induced pluripotent stem cell (hiPSC) differentiation into HLCs. Representative markers of each stage of differentiation are shown: pluripotency (NANOG, POU5F1), endoderm (SOX17), foregut (HHEX), hepatoblast (TBX3), foetal (AFP), and mature (ALB) hepatocytes. (B) mRNA levels of the four liver-enriched transcription factors (LETFs) tested in forward programming quantified throughout 30 days of hiPSC direct differentiation into HLCs. (C) Comparison of the mRNA levels of the four LETFs in differentiated HLCs in (B) with PHHs. (D) mRNA levels of hepatocyte markers ALB, SERPINA1, and AFP in undifferentiated hiPSCs, 30-day differentiated HLCs and PHHs. (E) mRNA levels of hepatocyte markers CYP3A4, CYP2A6, and CYP2C9 in undifferentiated hiPSCs, HLCs, and PHHs. All mRNA levels were normalised to the average of two housekeeping genes (PBGD and RPLP0). Bars represent mean with SD, and individual datapoints are shown for n=4 biological replicates. Statistical difference was calculated with one-way ANOVA, corrected for multiple comparisons compared to PHHs. p-Values are indicated as *p<0.05, **p<0.01, ***p<0.001, ****p<0.0001. (F,G) Dotplot showing the top 15 hits on gene ontology enrichment analysis on genes associated to cluster 2 and cluster 4 as shown in Figure 2D. The size of each dot represents number of genes associated to each term and the colours represent the adjusted p-value.