. 2022 Aug 12;11:e71591. doi: 10.7554/eLife.71591

Figure 3. Epigenetic status of regulatory regions differs between states of maturation in hepatocyte-like cells (HLCs) and primary human hepatocytes (PHHs).

(A) Principal component analysis (PCA) of the global enrichment profile of H3K27ac, H3K4me1, and H3K27me3 across two replicates of undifferentiated human induced pluripotent stem cells (hiPSCs), human embryonic stem cell (hESC), and hiPSC-derived HLCs, and PHHs. Average scores were computed for genomic regions of 1000 bp for the entire genome. (B) Average density plots and heatmaps showing enrichment levels for H3K27ac, H3K4me1, and H3K27me3 within a 10 kb window centred at H3K27ac PHH-unique (blue) or HLC-unique (green) regions. Scales are adjusted to maximum peak intensity for each dataset. (C) Enrichment profiles of H3K27ac, H3K4me1, and H3K27me3 across the UGT1A locus. Profiles are shown for one replicate of undifferentiated hiPSCs, hESC, and hiPSC-derived HLCs, and PHHs. Red bars represent PHH-unique H3K27ac peaks. (D) Nuclear receptor motifs identified as overrepresented binding sites at H3K27ac PHH-unique regions.

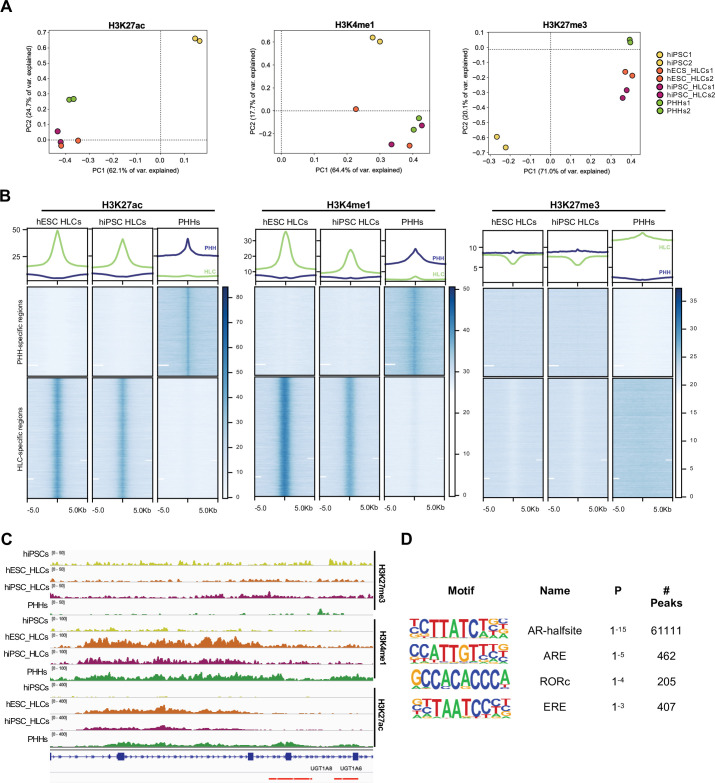
Figure 3—source data 1. Peak annotation results for primary human hepatocyte (PHH)-unique H3K27ac regions.
Figure 3—source data 2. Peak annotation results for hepatocyte-like cell (HLC)-unique H3K27ac regions.
Figure 3—source data 3. Motif enrichment results for primary human hepatocyte (PHH)-unique H3K27ac regions.

Figure 3.

Figure 3—figure supplement 1. Comparison of the epigenetic profile of hepatocyte-like cells (HLCs) and primary human hepatocytes (PHHs).

Figure 3—figure supplement 1.

(A) Distance to TSS of H3K27ac peaks identified in the PHH and HLC datasets. (B) Enrichment profiles of H3K27ac, H3K4me1, and H3K27me3 across the CYP3A4 locus. Profiles are shown for one replicate of undifferentiated human induced pluripotent stem cells (hiPSCs), human embryonic stem cell (hESC) and hiPSC-derived HLCs, and PHHs. Red bars represent PHH-unique H3K27ac peaks. (C) Bar plot showing the top 15 hits on gene ontology enrichment analysis on genes annotated to PHH or HLC-unique H3K27ac positive regions. The colour gradient represents the adjusted p-value. (D) Principal component analysis (PCA) of the expression profiles in mouse livers harvested at E12.5, E16.5, P0, and adult stages (8 and 10 weeks). Two biological replicates of each timepoint are shown. (E) Heatmap showing the relative expression of genes annotated as nuclear receptors across different stages of liver development, ordered left to right. Hierarchical clustering on gene expression levels was generated by Euclidean distance. Top clusters represent genes with highest expression changes between foetal and adult stages. (F) Normalised counts for three nuclear receptors (Rory, Esr1, and Ar) across different stages of liver development, showing expression increasing in the adult stage.