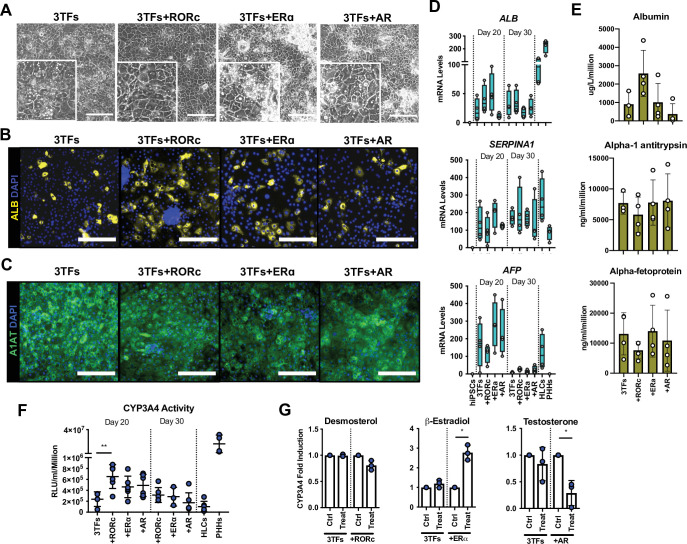
Figure 4. Forward programming of human embryonic stem cells (hESCs) into hepatocytes with nuclear receptors.
(A) Phase contrast images and (B) immunofluorescence staining for Albumin (yellow) and (C) A1AT (green) in hESCs forward programmed for 20 days with 3TFs alone or in combination with the nuclear receptors RORc, ERɑ, and AR. Nuclei were counterstained with DAPI (blue). Scale bars, 200 µm. (D) mRNA levels of hepatocyte markers (ALB, SERPINA1, and AFP) in FoP-Heps generated with 3TFs alone or in combination with nuclear receptors for 20 and 30 days (n=4). Expression data was normalised to the average of two housekeeping genes (PBGD and RPLP0). (E) Protein secretion levels of Albumin, A1AT, and AFP in hESC-derived FoP-Heps generated with 3TFs alone or in combination with nuclear receptors for 20 days (n=4). Data was normalised per total cell number (millions). (F) CYP3A4 activity levels normalised per cell number (millions) in FoP-Heps targeted with 3TFs with or without nuclear receptors, after 20 and 30 days of forward programming (n=3–6). Statistical differences were calculated with one-way ANOVA, corrected for multiple comparisons compared to 3TFs (day 20). (G) CYP3A4 fold induction levels in FoP-Heps treated with 100 nM of the ligands as indicated from day 2. Data is normalised to untreated control at day 20 of forward programming (n=3). Statistical differences were calculated with paired t-test. In all plots, bars represent mean with SD, and individual datapoints are shown for all biological replicates. Hepatocyte-like cells (HLCs) generated by direct differentiation and primary human hepatocytes (PHHs) where plotted as controls for CYP3A4 activity and expression data. Significant p-values are shown at each comparison and indicated as *p<0.05, **p<0.01, ***p<0.001, ****p<0.0001.


