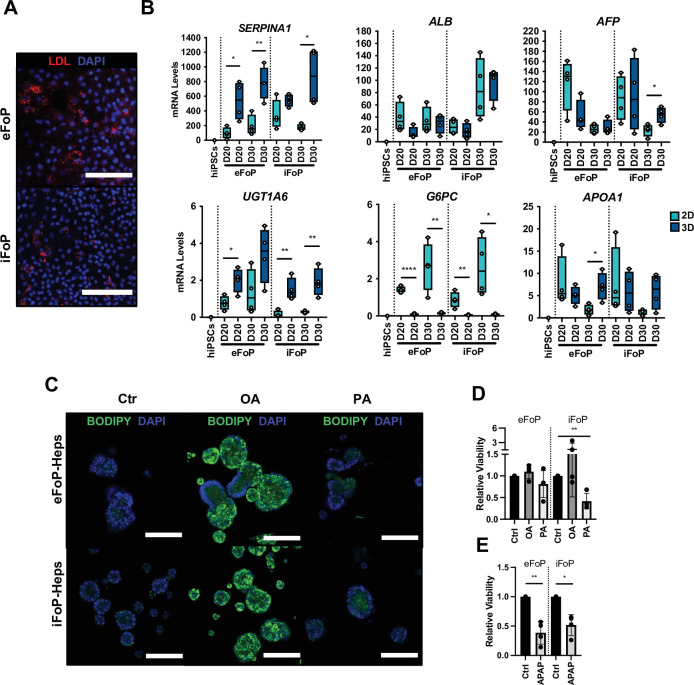
Figure 6. RORc promotes functionality of 4TF FoP-Heps.
(A) Immunofluorescence staining for LDL in FoP-Heps at day 20 of forward programming. Scale bars, 200 µm. Nuclei were counterstained with DAPI (blue). (B) Comparison of mRNA levels of SERPINA1, ALB, AFP, UGT1A6, G6PC, and APOA1 in FoP-Heps cultured in 2D and 3D for up to 20 or 30 days of forward programming (n=4). Statistical difference between 2D and 3D were calculated with unpaired t-test. All expression data was normalised to the average of two housekeeping genes (PBGD and RPLP0). In all plots, bars represent mean with SD, and individual datapoints are shown for all biological replicates. p-Values are indicated as *p<0.05, **p<0.01, ***p<0.001, ****p<0.0001. (C) BODIPY staining of FoP-Heps cultured in 3D from day 20 of forward programming and treated with fatty acids (oleic acid [OA], palmitic acid [PA], or BSA [Ctr]) as indicated for 7 days. Scale bars, 200 µm. Nuclei were counterstained with DAPI (blue). (D) Cell viability in FoP-Heps treated with the fatty acids as indicated, normalised against FoP-Heps treated with BSA as control (n=4). (E) Cell viability in FoP-Heps treated with 25 mM of acetaminophen (APAP) for 48 hr in 3D cultures, normalised against untreated FoP-Heps (n=4). Significant differences were determined with paired t-test. In all plots, bars represent mean with SD, and individual datapoints are shown for all biological replicates. p-Values are indicated as *p<0.05, **p<0.01, ***p<0.001, ****p<0.0001.

