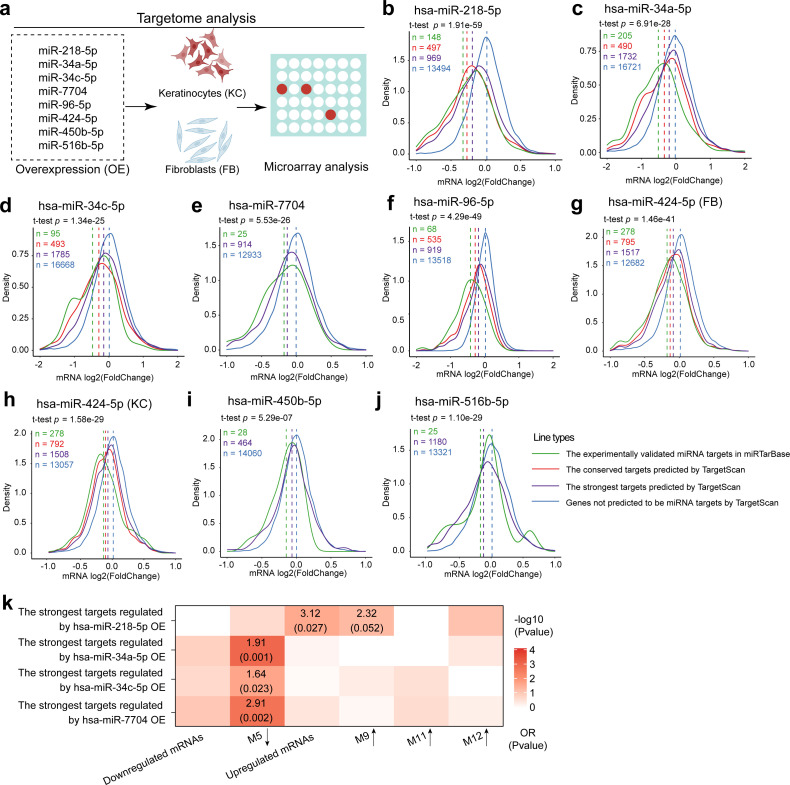
Figure 6. Targetome analysis of the dysregulated miRNAs in human primary keratinocytes or fibroblasts.
(a) A schematic diagram of targetome analysis. Microarray analysis was performed in keratinocytes (KC) or fibroblasts (FB) with miR-218-5p (b), miR-34a-5p (c), miR-34c-5p (d), miR-7704 (e), miR-96-5p (f), miR-424-5p (g, h), miR-450-5p (i), or miR-516-5p (j) overexpression (OE). Density plots of mRNA log2(fold change) are shown. Wilcoxon t-tests were performed to compare the TargetScan predicted strongest targets (purple) with the nontargets (blue) for each of these miRNAs. The conserved and experimentally validated targets are marked with red and green colors, respectively. Dotted lines depict the average log2(fold change) values for each mRNA group. (k) A heatmap shows the enrichment for venous ulcer (VU)-affected mRNAs and mRNA modules in the targets of miR-218-5p, miR-34a-5p, miR-34c-5p, or miR-7704 validated by the microarray analysis. Odds ratio (OR) and p values are shown when OR >1 and p value <0.05 (Fisher’s exact test).


