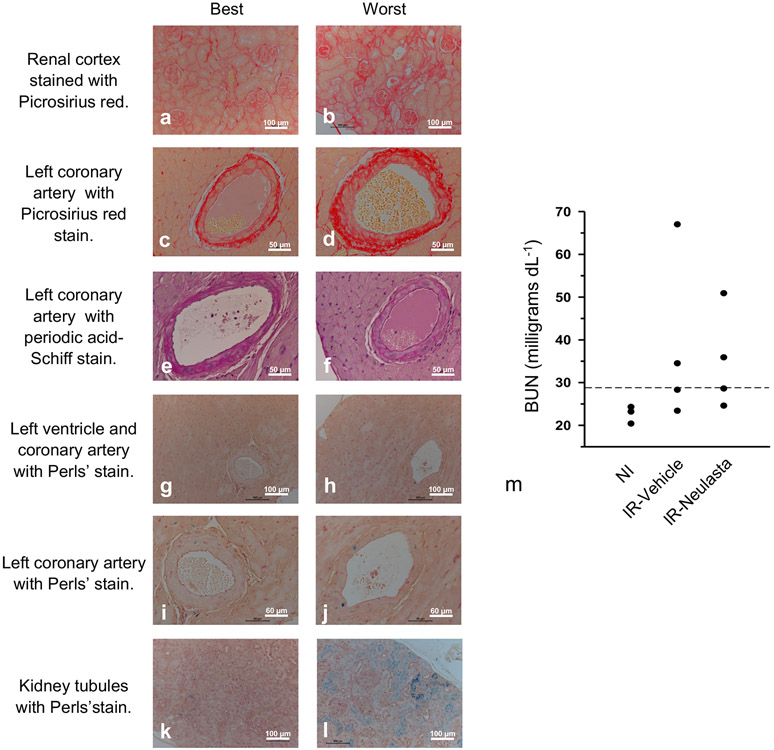
Figure 6.
Variation in radiation-induced renal and cardiovascular pathology. Representative images are shown to illustrate the range of pathology observed in the renal cortex and left ventricle/coronary artery in terms of collagen deposition (picrosirius red, a-d), endothelial cell number or density (periodic acid-Schiff, e and f) and iron deposition (Perls’ stain, blue, g-l). The left and right panels represent the minimal and worst pathology, respectively, observed in the 8 JDO mice examined at 12 mo post-TBI. Increased blood urea nitrogen (BUN) 12 mo post-TBI in vehicle (Veh)-or Neulasta (Neu)-treated mice is shown compared to age-matched NI mice (m). Dotted line indicates published upper range BUN reference value for mice as described in the results.

