
Figure 3.
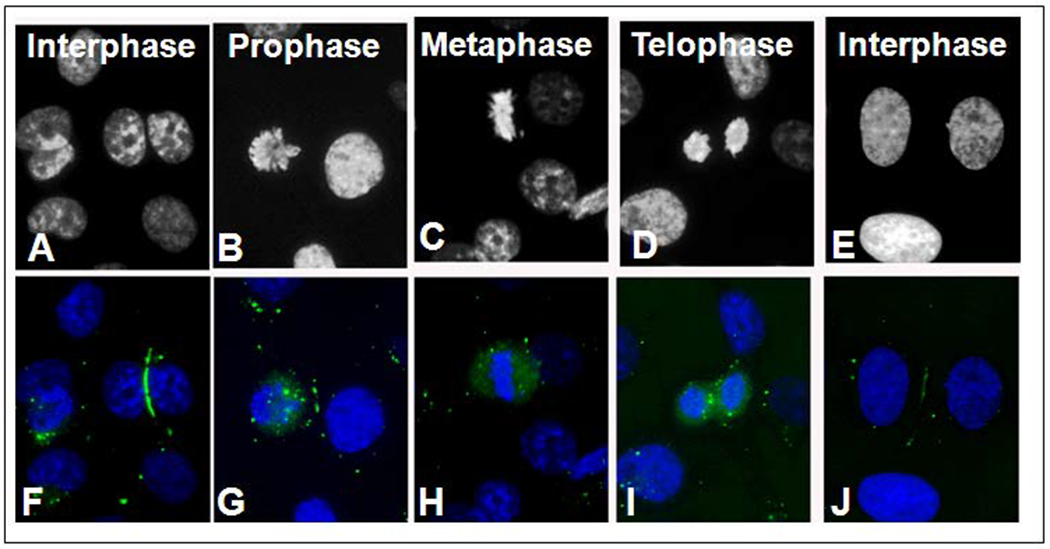
Chromatin and Cx43-GFP distribution during mitosis. The mitotic stages can be determined from the chromatin distribution seen with Hoechst staining (A-E). In the corresponding color images, Cx43-GFP gap junction plaques (green) decreased starting with prophase, while the number of cytoplasmic puncta increased (F-J). The number of puncta seen in the images for each mitotic stage are as follows: Interphase (1), Prophase (19), Metaphase (12), and Telophase (10). Bar: 10μm A-J.