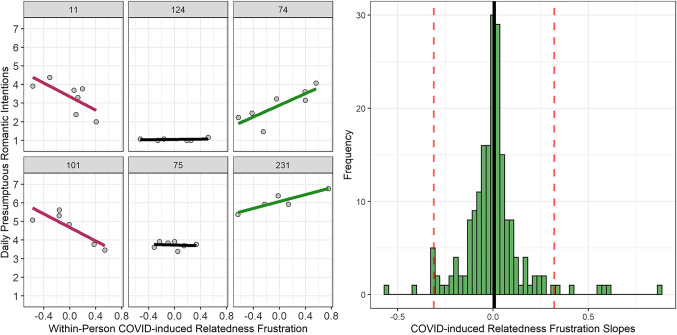
Fig. 3.
Representative Participant Slopes (left) and Distribution of Slopes (right) for COVID-induced Relatedness Frustration Predicting Daily Presumptuous Romantic Intentions in Study 2. Note. In the left-hand plot, numbers above each panel represent that participant’s randomly designated ID. In the right-hand plot, the black line represents the fixed effect, and the dashed red lines indicate a 95% confidence interval computed from the random effect

