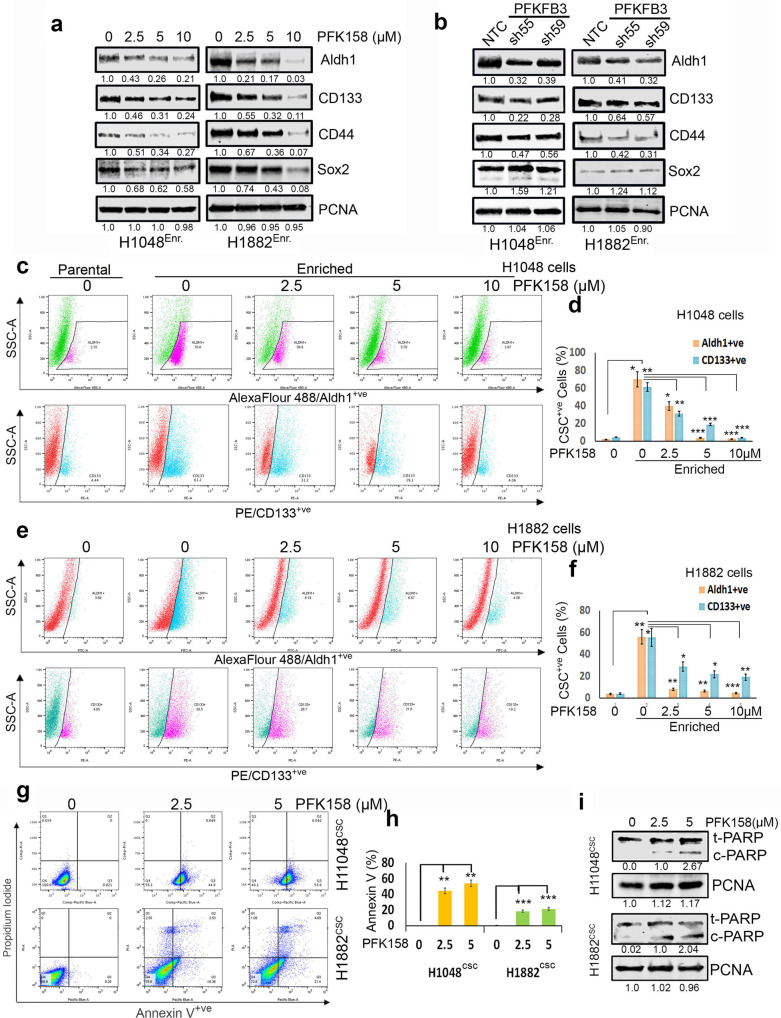
Fig. 1. Deficient PFKFB3 causes downregulation of cancer stem cell markers and cell death.
a Expression levels of CSC markers including Aldh1, CD133, CD44, and Sox2 in enriched 3D cultures of H1048 and H1882 cells by western blot analysis. b The effect of PFKFB3 depletion by shRNAs on CSC markers level in enriched 3D cultures of H1048 and H1882 cells. c Aldh1 (pink)/CD133 (blue) was very higher level in CSC enriched 3D culture compared to parental cells and exposure to PFK158 at indicated concentrations decreased detection of both Aldh1+ve/CD133+ve levels in H1048 spheroids. The pink (first panel) and blue (second panel) gating boxed represent unique Aldh1high /CD133high cells in H1048 spheroids. d PFK158 mediated decrease of CSC markers Aldh1+ve/CD133+ve cells. e Aldh1 (blue)/ CD133 (pink) expressing cells are more in 3D spheroids compared to parental 2D cultures and Dot plot for expression of cancer stemness markers Aldh1 and CD133 analyzed with FACS depicting concentration dependant decrease CSC markers upon PFK158 treatment. The blue (first panel) and pink (second panel) gating boxed represent unique Aldh1high /CD133high cells respectively, in H1882 spheroids. f Percentage of CSC Aldh1+ve/CD133+ve cells in H1882 spheroids. g Determination of the early and late apoptotic cells after exposure to PFK158 at specified concentrations by Annexin V-Pacific Blue and PI dual stain in H1048CSC and H1882CSC spheroids. h Bar graph depicts percentage of Annexin-V-positive/apoptotic cells. i immunoblot analysis of cleaved PARP level after PFK158 treatment in H1048CSC and H1882CSC cells. PCNA used as loading control. The experiment was repeated thrice (n = 3), and the graphs are represented as mean ± S.D. Significance measured comparing individual groups with control is represented as *p < 0.05, **p < 0.01, ***p < 0.001.

