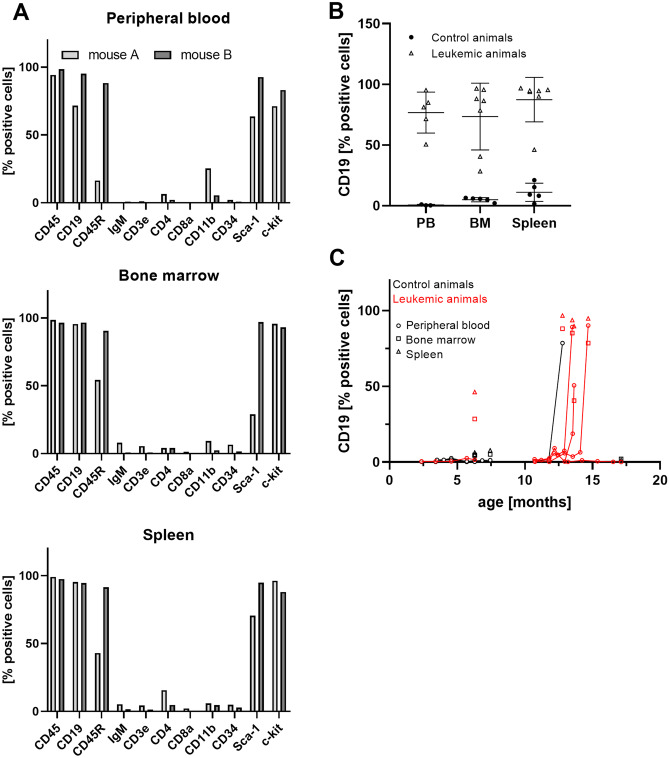
Fig. 4.
Flow cytometric analysis of spleen, bone marrow, and peripheral blood in paralysis-affected RAG1-deficient mice and controls. A Characterization of the tumor cell population was carried out in peripheral blood, bone marrow, and spleen cells of two representative paralyzed animals. B Frequency of CD19+ cells in peripheral blood (PB), bone marrow (BM), and spleens of leukemic (open triangles) and control animals (filled circles). Mean ± SD. C Time-dependent development of the CD19+ tumor cell population in affected animals (red) while no leukemic blasts were detected in designated controls (black). Tumor cell frequencies in blood, bone marrow and spleens are displayed as circles, squares, and triangles, respectively. All graphs show the ratio of the concerning cell type in relation to all live cells

