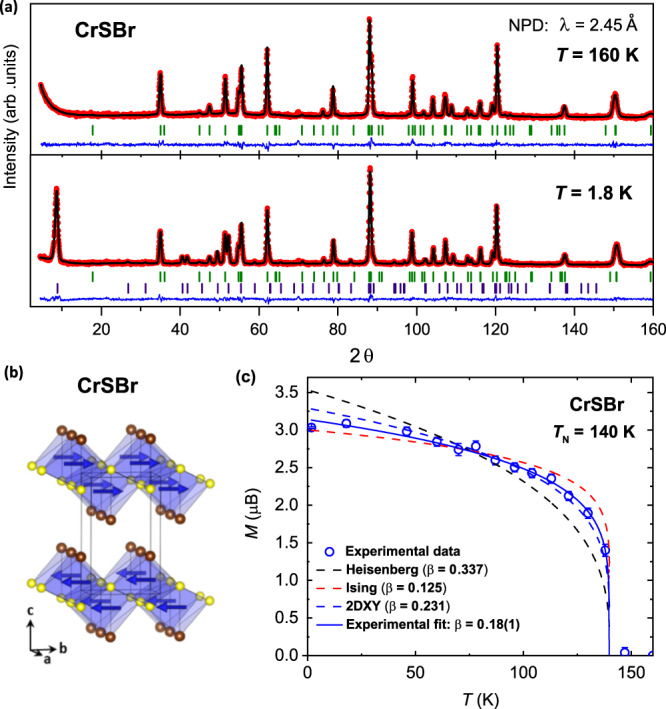
Fig. 2. Long-range magnetic order in CrSBr.

a Rietveld refinement of the neutron powder diffraction (NPD) data at 160 K (upper panel) and 1.8 K (lower panel) for CrSBr. The red dots correspond to the observed intensities, the black line to the calculated intensity and the blue line is the difference plot. Green and purple ticks show the Bragg reflections for the structural and magnetic phase, respectively. b Solved magnetic structure of CrSBr from NPD data. Sulfur and bromine atoms are shown in yellow and brown color, and Cr atoms are omitted for clarity. The magnetic moments are ferromagnetically aligned along the b-direction within the monolayer. The ferromagnetic layers are then interlayer coupled antiferromagnetically. c Temperature dependence of the refined magnetic moment (blue circles). The error bars represent the standard deviation of the fitted values. The dashed lines correspond to the power law with the different critical exponents of the corresponding models. The continuous blue line is the fit to the measured data.
