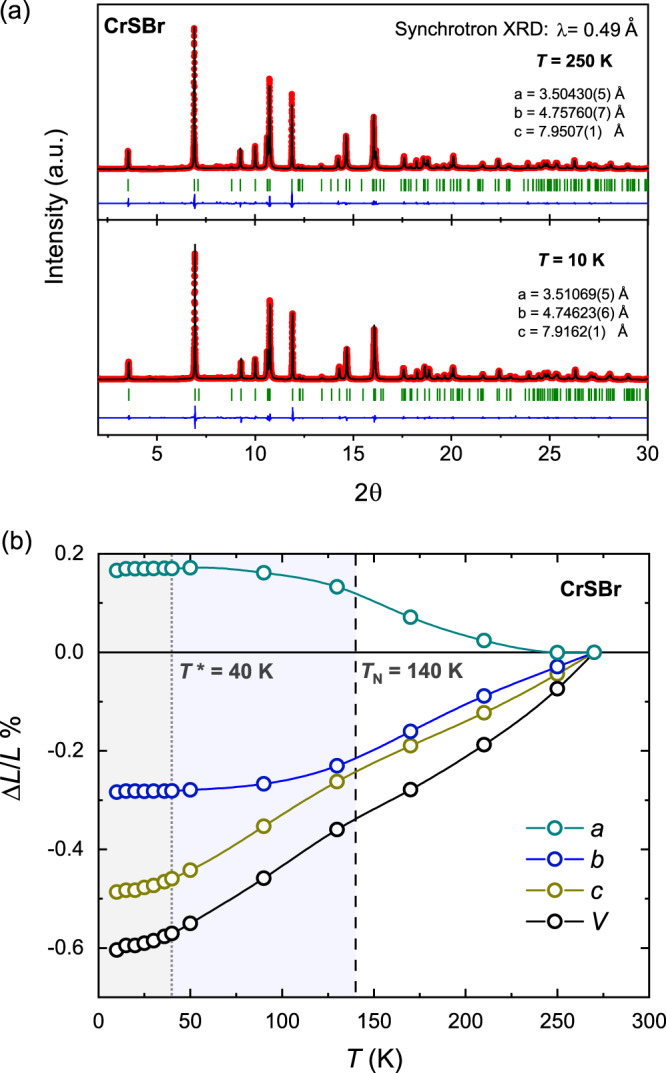
Fig. 5. Temperature-dependent structural data of CrSBr.

a The synchrotron X-ray diffraction (XRD) data of CrSBr measured with a wavelength of λ = 0.49 Å at T = 250 K (upper panel) and 10 K (lower panel), with the respective Rietveld refinements in the space group Pmnm. Red dots and black line correspond to the observed and calculated intensities, the blue line is the difference plot and green ticks show the Bragg reflections. b Normalized unit cell parameters a, b, and c, as well as the unit cell volume V in a temperature range between T = 10 K and 270 K. The magnetically ordered temperature regions are highlighted by blue (T < TN) and gray (T < T*) shadings.
