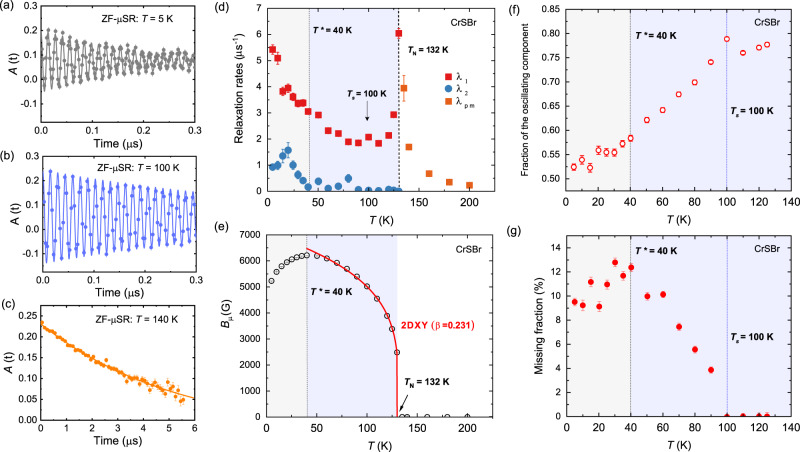
Fig. 6. ZF-μSR measurements on CrSBr.
a–c ZF-μSR spectra for CrSBr at different temperatures. Lines show fitting to Eqs. (3) and (4) (see Supplementary Note 4). Error bars in the μSR asymmetry are derived from the standard error of each bin over about ~106 events. d Temperature dependence of the muon spin relaxation rates λpm (orange squares), λ1 (red squares) and λ2 (blue circles). e Temperature dependence of the internal field (Bμ). Line shows fitting to a power law with a fixed critical exponent of β = 0.231 according to the 2DXY model. Temperature dependence of (f) the oscillation fraction and (g) the missing fraction. The magnetically ordered temperature regions are highlighted by blue (T < TN) and gray (T < T*) shadings. The error bars represent the standard deviation of the fitted parameters.

