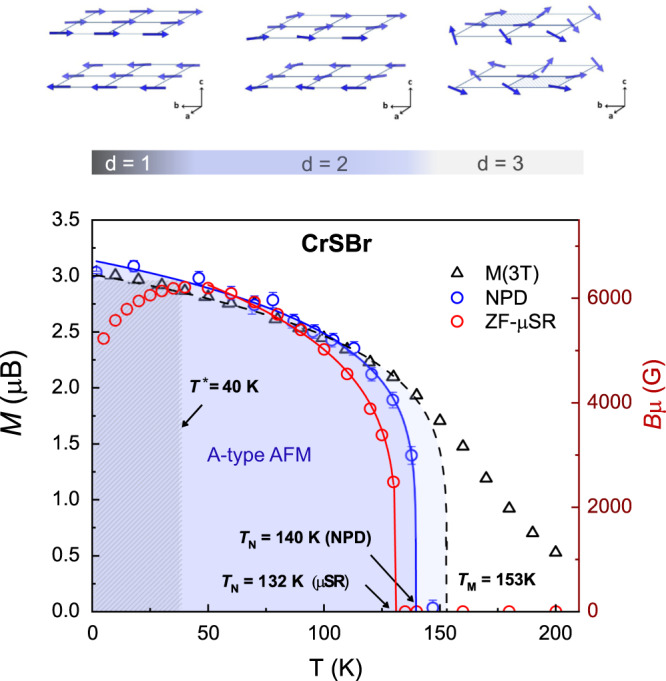
Fig. 7. Phase diagram of CrSBr.

Blue open circles show the magnetization values derived from the neutron powder diffraction (NPD) data, corresponding to the stablishing of the long-range A-type magnetic structure (blue region). The saturation values of the magnetization M(3T) are shown as black triangles, highlighting the precursor magnetic state below TM ≈ 153 K. Above TM, high magnetization values are still observed, reflecting an enhanced magnetic susceptibility at high temperature (i.e., in the paramagnetic state). Red open circles show the internal field derived from the ZF-μSR data (right scale, in red), showing the decrease in the internal field (Bμ) across the spin-freezing process. The error bars represent the standard deviation of the fitted parameters. Upper panel schematically show the proposed spin dimensionality (d) crossover.
