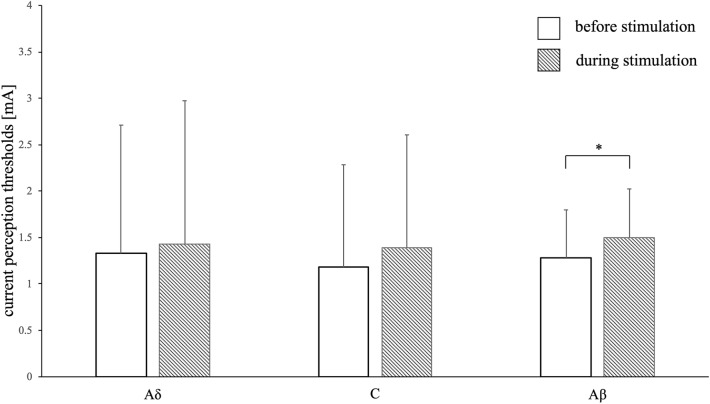
Figure 1.
Current perception thresholds under non-noxious condition. Differences in the mean value of current perception thresholds before and after non-noxious stimulation. The error bars indicate standard deviation. No significant changes are observed in the current perception thresholds of the Aδ and C fibers when the dorsal side of the forearm was lightly rubbed with a brush. A significant increase in the threshold of the Aβ fibers is observed. Asterisks represent significant differences (*P < 0.0083).

