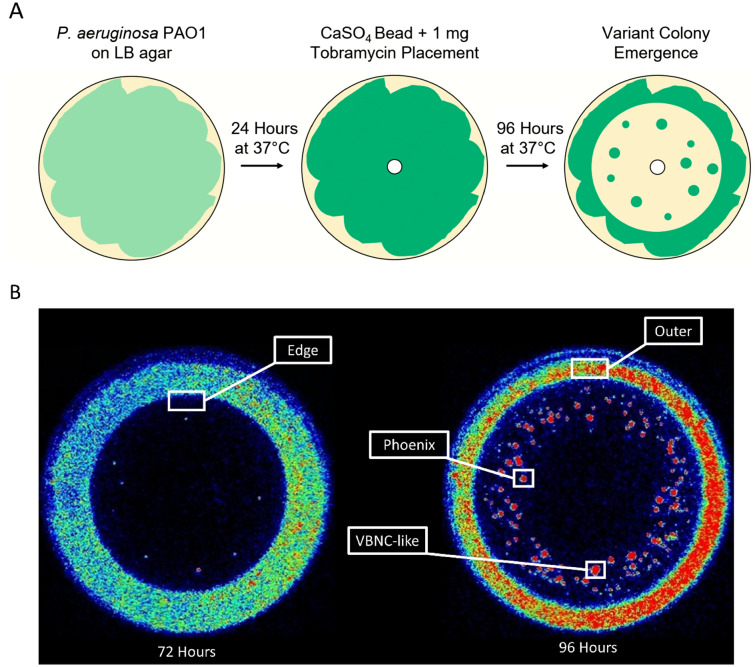
Figure 1.
Isolation of P. aeruginosa colony variants for assaying the genome and gene expression. (A) Diagram of the experimental methods for obtaining variant colony emergence for P. aeruginosa PAO1 with tobramycin. (B) In vitro imaging system (IVIS) images of representative phoenix colony plates show areas of bacterial sampling. Seventy-two hours post tobramycin bead placement, samples were taken from the edge of the zone of clearance (ZOC) where phoenix colonies would be expected to arise the following day after continued incubation. Ninety-six hours post tobramycin bead placement, samples were taken from phoenix colonies, VBNC-like colonies, and the outer background lawn. Additionally, samples were taken from bacterial lawns grown for 72 h that had not been exposed to antibiotics to be used as comparative controls. Red indicates high levels of metabolic activity, blue indicates low levels of metabolic activity, black indicates no metabolic activity.

