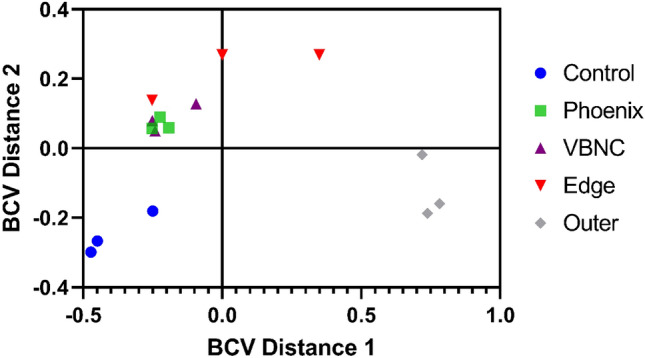
Figure 3.

Multi-dimensional scaling (MDS) plot showing clustering of isolates. An MDS plot was generated using biological coefficients of variation (BCV) from transcript counts for each isolate sample. Samples from each group cluster well together aside from the Edge samples, and the phoenix colonies and VBNC-like colonies overlap considerably. Control lawn, Edge, and Outer samples cluster on their own and separately from the Phoenix and VBNC-like samples.
