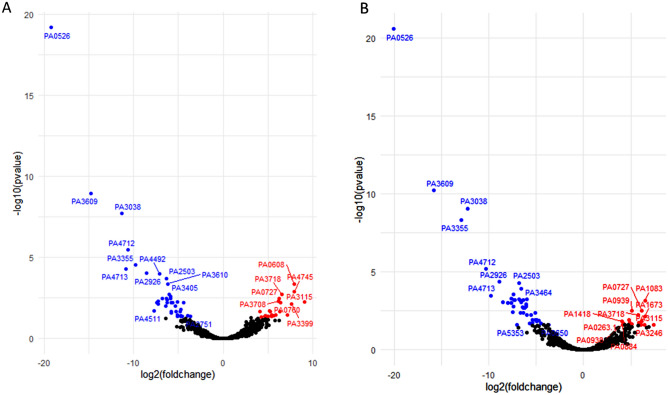
Figure 4.
Volcano plots of DEGs. (A) Comparison of phoenix colony transcript counts to control lawn transcript counts showed 63 DEGs. (B) Comparison of VBNC-like colony transcript counts to control lawn transcript counts showed 90 DEGs. (A, B) Red dots indicate gene transcripts which were significantly upregulated (greater than twofold change and corrected p-value of 0.05 or less). Blue dots indicate gene transcripts which were significantly downregulated (greater than twofold change and corrected p-value of 0.05 or less). Black dots indicate genes with no-significant difference in transcription.

