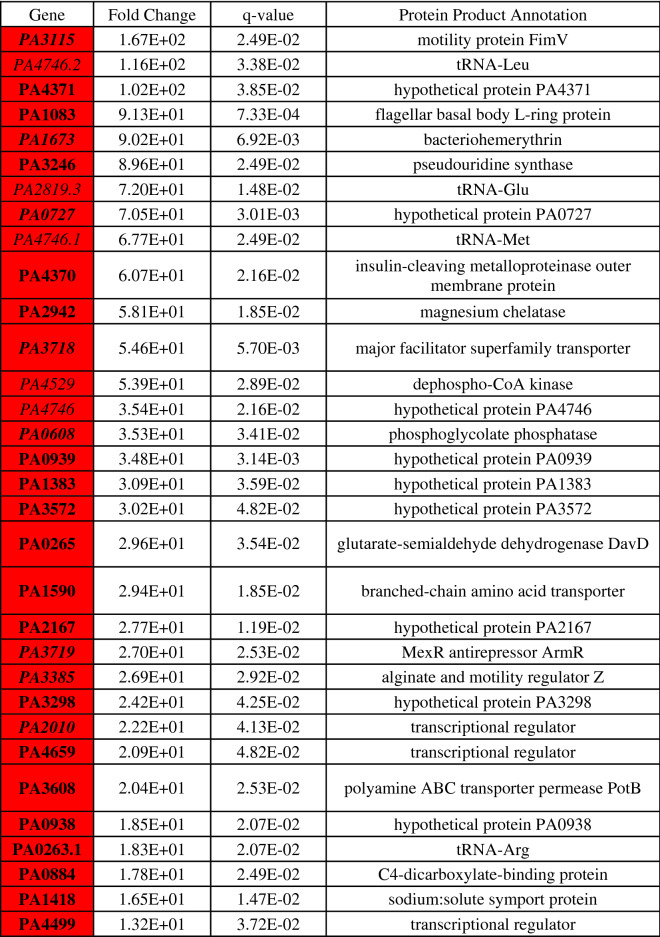
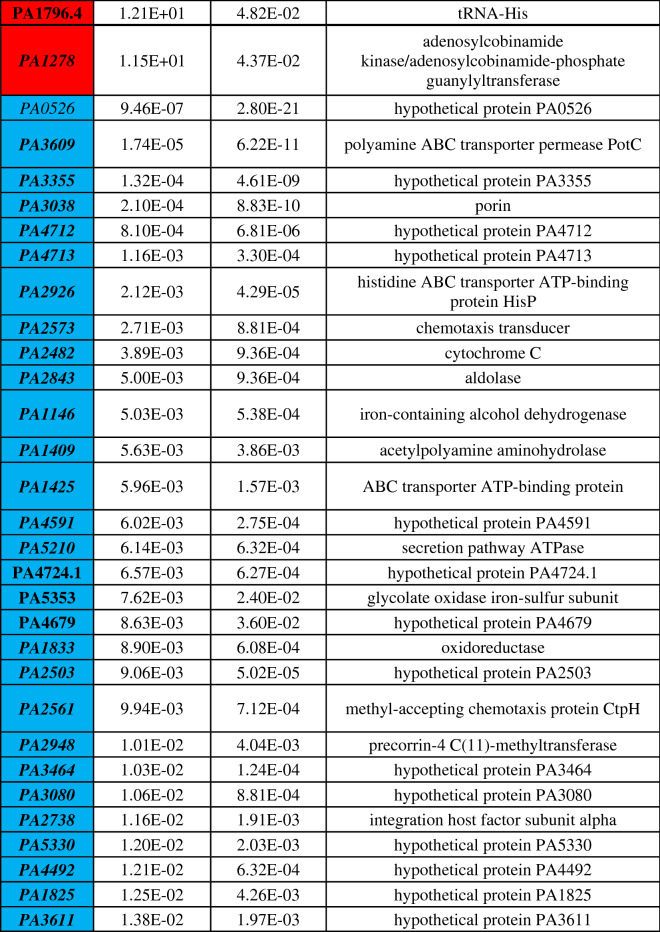
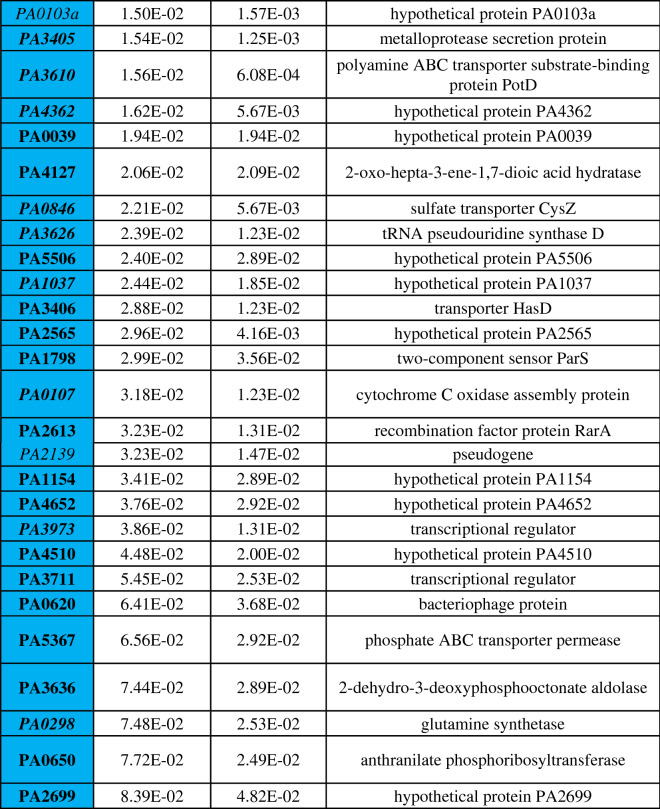
Table 2.
Statistically significant DEGs of VBNC-like colonies.
VBNC-like colony transcripts were compared to the control lawn to identify genes which were significantly up or down regulated. Red indicates genes which were significantly upregulated and blue indicates genes which were significantly downregulated. Genes in bold were screened using transposon mutants. Genes in italics are shared by both phoenix colonies and VBNC-like colonies.


