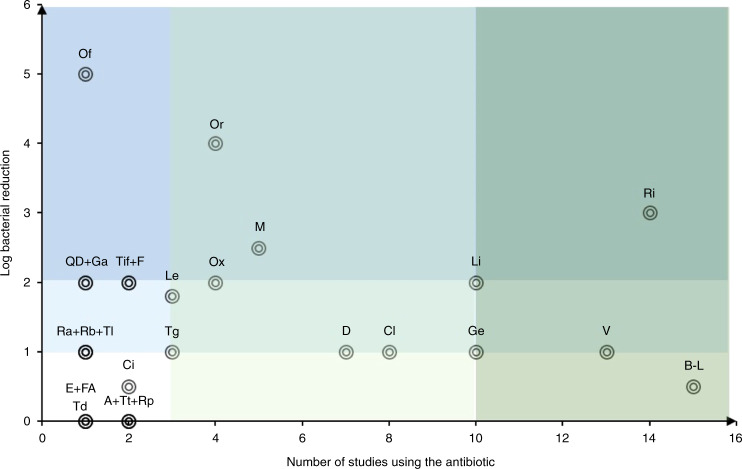
Fig. 3.
A representation of the effectiveness of antibiotics against intracellular S. aureus and the number of studies that tested the antibiotic. A typical log-reduction value for each antibiotic formulation, which was either reported or gauged from data included in the study in question, was assigned (y-axis) and plotted against the number of studies contributing to these values (x-axis). Supporting data for this analysis are detailed in Tables 1–3. Dark blue zone = high effectiveness, light blue zone = medium effectiveness, white zone = low effectiveness. Dark green zone = highest number of studies, light green zone = low number of studies, white zone = individual studies. A = azithromycin, B-L = beta-lactam antibiotics (except oxacillin), Ci = ciprofloxacin, Cl = clindamycin, D = daptomycin, E = erythromycin, F = fosfomycin, FA = fusidic acid, Ga = garenoxacin, Ge = gentamicin, Le = levofloxacin, Li = linezolid, M = moxifloxacin, Of = ofloxacin, Or = oritavancin, Ox = oxacillin, QD = quinupristin/dalfopristin, Ra = radezolid, Rb = rifabutin, Ri = rifampicin, Rp = rifapentin, Td = tedizolid, Tg = tigecycline, Ti = teicoplanin, Tl = telavancin, Tt = telithromycin, V = vancomycin

