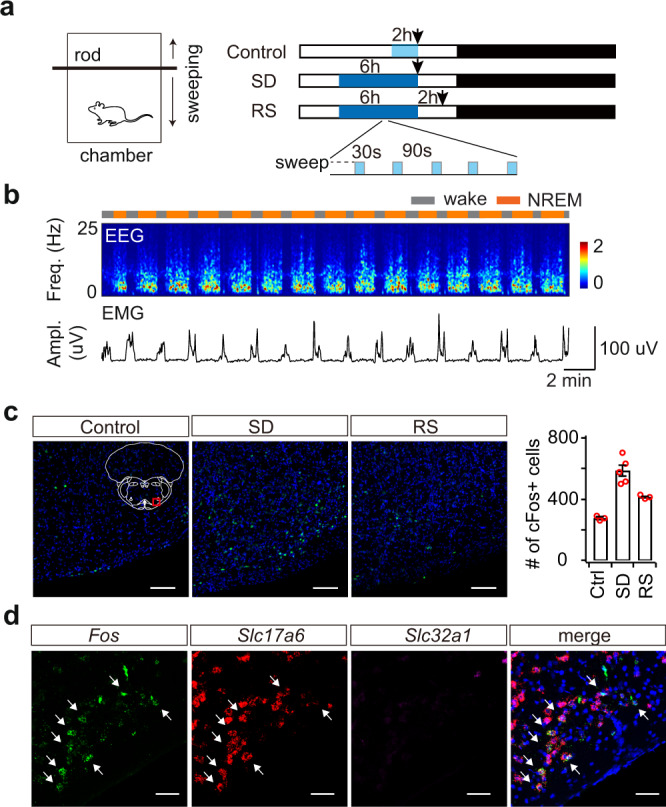
Fig. 1. Medulla glutamatergic neurons are active during wake–sleep transitions.

a Schematic of sleep deprivation. Animals were divided into three groups: 1) control, 2-h sweeping before perfusion, 2) sleep deprivation (SD) by 6-h intermittent sweeping (30 s on, 90 s off), 3) recovery sleep (RS) after deprivation. Arrows indicate perfusion time. b Representative EEG spectrogram and EMG trace showing 30-min sleep pattern at the 5th hour of sleep deprivation. Brain states: gray, wake; orange, NREM sleep. c Fluorescence images of c-Fos immunostaining (green) in the VLM of three groups: control, SD, and RS. Blue, DAPI. Scale bars, 100 μm. Inset, mouse brain coronal section (Bregma −6.9 mm), adapted from Allen mouse brain atlas (http://atlas.brain-map.org). Red box indicated the region of fluorescence images. Right, Quantitation of c-Fos+ cells in the VLM in each group (n = 3 mice for control, n = 5 for SD, n = 3 for RS). Data are presented as mean ± SEM. Source data are provided as a Source Data file. d Triple fluorescence in situ hybridization (FISH) of Fos and neuronal markers in the VLM of a SD mouse (n = 2 mice). Slc17a6, vesicular glutamate transporter 2; Slc32a1, vesicular GABA transporter. Arrows indicated the overlapped cells between Fos and Slc17a6. Blue, DAPI. Scale bars, 50 μm.
