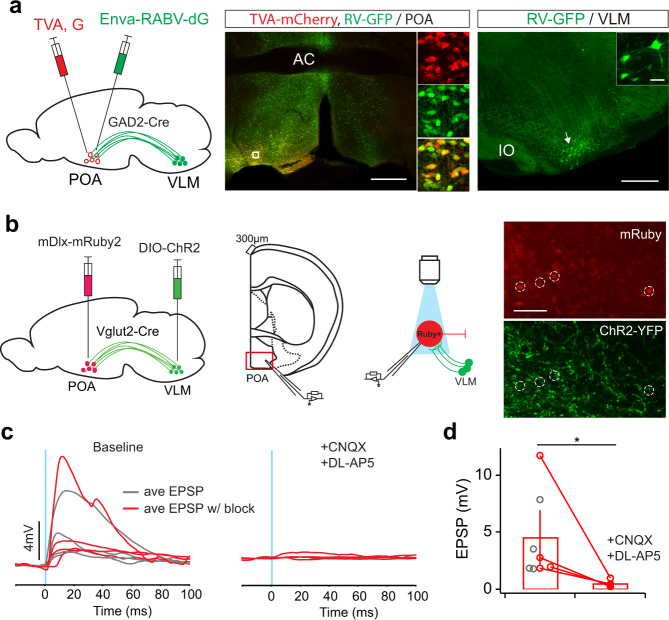
Fig. 4. VLM glutamatergic neurons activate GABAergic neurons in the POA.
a Monosynaptic retrograde tracing from the POA to VLM in GAD2-Cre mice. Left, schematic of experimental design. The POA of GAD2-Cre animals were infected with AAV-FLEX-G(N2C)-mKate and AAV-FLEX-TVA-mCherry, followed by infection with RABV-ΔG-GFP-EnvA. Middle, fluorescence image of the injection site in the POA. Scale bar, 500 μm. Enlarged view of the region in the white box showing starter cells labeled by mCherry (red), Rabies-labeled cells labeled by GFP (green). Right, Rabies-labeled cells in the VLM indicated by GFP expression (green). Representative of 2 mice. Scale bar, 500 μm. Arrow indicates cells in inset. Scale bar, 20 μm. b Schematic of experimental design. AAV-DIO-ChR2-eYFP was injected unilaterally in the VLM, AAV-mDlx-mRuby2 injected contralaterally in the POA of Vglut2-Cre mice. Recordings were performed in mRuby+ cells in the POA while light stimulation was delivered to activate ChR2-expressing VLM glutamatergic axons. Right, Fluorescence images showing expression of mRuby and ChR2-eYFP in the POA (n = 6 mice). Scale bar, 50 μm. c Excitatory post-synaptic potentials (EPSPs) evoked by optogenetic stimulation (blue line, 1 ms) before (left, or baseline) and after (right) glutamatergic receptor antagonists CNXQ (10 μM) and DL-AP5 (10 μM). Each trace represents averaged response across 5 sweeps in one cell. Cells with pharmacological block are highlighted in red. d Quantitation of average EPSP amplitudes (n = 8 cells from 6 Vlgut2-Cre mice, among them, 4 cells with pharmacological block are used for the bar graph and statistical comparison, Error bars, SEM, *P = 0.028 Mann–Whitney U-test). Source data are provided as a Source Data file.

