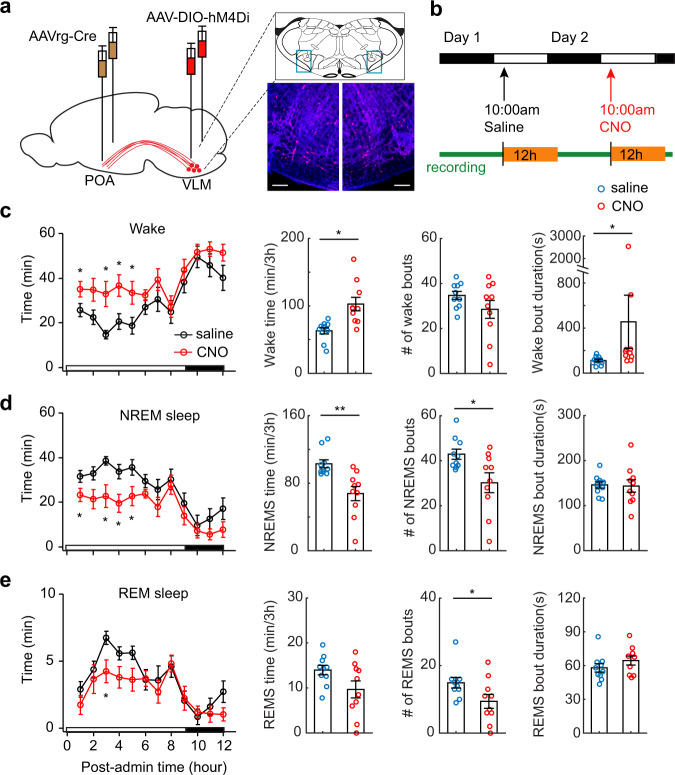
Fig. 5. Silencing POA-projecting medulla neurons disrupts the transitions from wakefulness to sleep.
a Schematic of chemogenetic inhibition. AAVrg-Cre was bilaterally injected in the POA and AAV9-hSyn-DIO-hM4D(Gi)-mCherry was bilaterally injected in the VLM of wild-type mice. Right, Fluorescence images of coronal sections in the VLM (blue boxes above) showing bilateral expression of inhibitory DREADDs (n = 8 mice). Mouse brain figure adapted from Allen mouse brain atlas. Red, mCherry, Blue, DAPI. Scale bars, 100 μm. b Schematic of drug administration and sleep recording. c Wake time per hour over a 12-h time window following CNO (1 mg/kg, i.p. red circles) and saline (black circles) treatments. Right, quantitation of the total wake time (P = 0.011), wake bouts (P = 0.150), bout durations (P = 0.016 without two outliers) over 3-h after treatments. d Quantitation of hourly NREM sleep time over 12-h, the total NREM time (P = 0.0098), bouts (P = 0.023), and bout durations (P = 0.869) over 3-h after CNO and saline treatments. e Quantitation of hourly REM sleep time over 12-h, the total REM time (P = 0.061), bouts (P = 0.0198), and bout durations (P = 0.129) over 3-h after CNO and saline treatments. Data are mean ± SEM in panel c–e. For all statistics, n = 10 animals, two-sided paired t-test, *P < 0.05, **p < 0.01. Source data are provided as a Source Data file.

