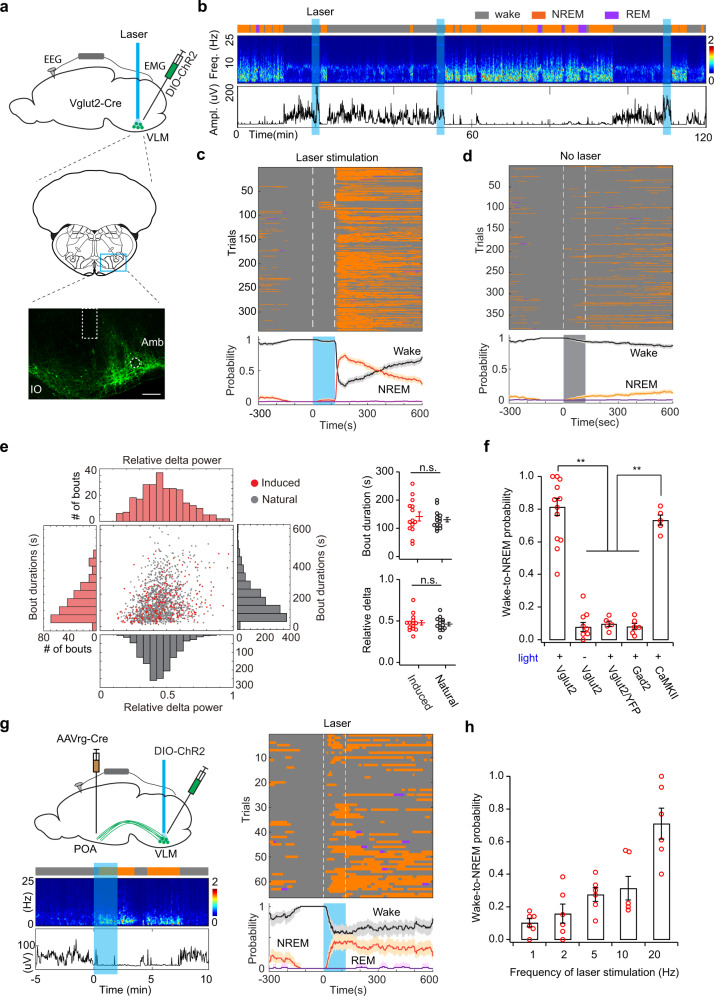
Fig. 7. Optogenetic activation of medulla glutamatergic neurons induce NREM sleep in awake animals.
a Schematic of optogenetic experiment. Middle, a coronal section (adapted from Allen mouse brain atlas). Bottom, fluorescence image of VLM (blue box) in a Vglut2-Cre mouse injected with AAV-DIO-ChR2-eYFP (n = 13 mice). Dashed box indicates the placement of optical fiber. Amb nucleus ambiguus; IO inferior olivary complex. Scale bar 200 μm. b Representative EEG spectrogram and EMG trace in a 2-h session with photostimulation (20 Hz, 2 min, blue shades). Brain states: orange, NREM; purple, REM; gray, wake. c Brain states before, during and after laser stimulation (white dash lines) in awake animals (n = 14). Bottom, probability of wake (black), NREM (orange), and REM sleep (purple). d Brain states in no light animals (n = 10). e Scatter plots and distributions of bout durations and relative delta power during NREM sleep (n = 14 animals). Right, quantitation of bout durations (upper, P = 0.588) and relative delta power (bottom, P = 0.703) (n = 14, n.s. no significance, two-sided unpaired t-test). Error bars, SEM. f Quantification of transition probability from wakefulness to NREM sleep induced by optogenetic activation (n = 14 animals for Vglut2-Cre with light, n = 10 for Vglut2-Cre without light, n = 5 for Vglut2-Cre/YFP, n = 6 for Gad2-Cre, n = 5 for CaMKII, Mann–Whitney U-test, **P < 0.0006 between Vglut2+light and control, P < 0.008 between CaMKII and control, control refers to Vglut2 no light, Vglut2/YFP, and Gad2+light, P = 0.286 between Vglut2+light and CaMKII). Error bars, SEM. g Optogenetic stimulation of POA-projecting VLM neurons. Left upper, schematic of experimental design. AAVrg-Cre injected unilaterally in POA, AAV-DIO-ChR2-eYFP injected in VLM in wild-type mice. Left bottom, a trial of optogenetic activation (20 Hz, 2 min). Right, brain states and probability before, during, and after laser stimulation (66 trials from 3 mice). Traces in c, d, g are presented as mean ± 95% bootstrap confidence intervals. h Quantitation of wake–sleep transition probability under different frequencies of laser stimulation (2 min, n = 6 Vglut2-Cre mice). Error bars, SEM. Source data are provided as a Source Data file.

