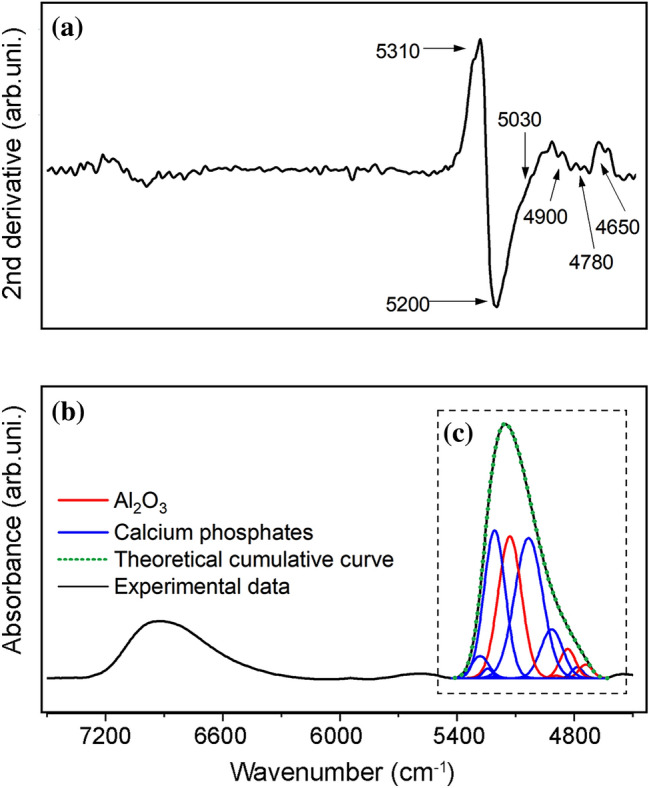
Fig. 5.

a Second derivative of the spectrum, b NIR spectrum of the A15PE surface after 21 days of incubation, and (c) illustration of the “deconvolved analytical curves”, where the blue bands represent the calcium phosphates and the red ones the Al2O3
