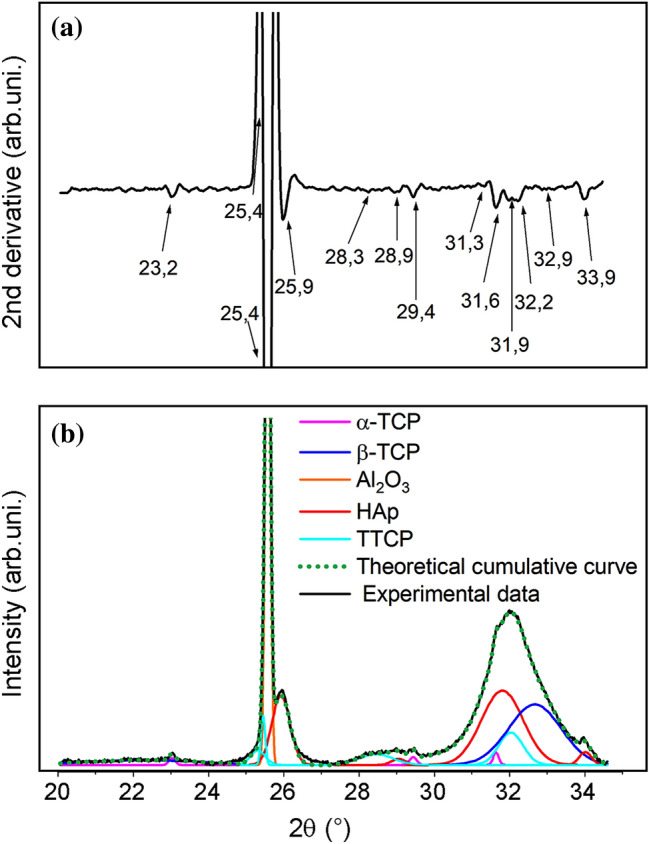
Fig. 6.

a Second derivative of the XRD diffractogram and b diffractogram of the A15PE surface after 21 days of incubation with an illustration of the “deconvolved analytical curves”, where each colour represents the different phases of calcium phosphates
