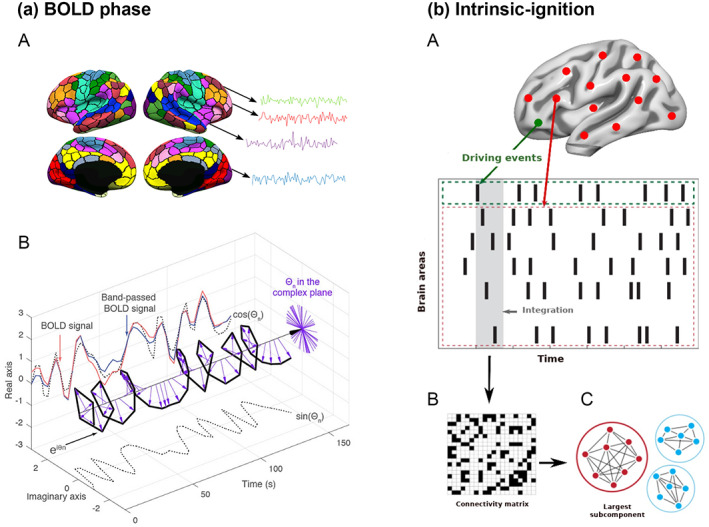
FIGURE 1.

Intrinsic ignition framework. (a) We extracted the BOLD time series for each of the 1000 brain areas and computed the phase space of the BOLD signal. (a‐A) We obtained the time series for each parcellation using the resting‐state Schaefer atlas (Schaefer et al., 2018). (a‐B) Then, we measured the phase space of the BOLD signal through the Hilbert transform for each region. The BOLD signal (red) was band‐pass filtered between 0.04 and 0.07 Hz (blue) and using the Hilbert transform. The phase dynamics can be represented in the complex plane as eiφ (black bold line), the real part as cos φ, and the imaginary part as sin φ (black dotted lines). The purple arrows represent the Hilbert phases at each TR (2.5 s). (b) Intrinsic ignition measurements. (b‐A) Events were captured by applying a threshold method (Tagliazucchi et al., 2012 see green node). For each event elicited, the activity in the rest of the network (see red stippled region) was measured in the time window of 4‐TR (4 × 2.5 s) (gray area). (b‐B) A binarized phase lock matrix was obtained from the time window. (b‐C) From this phase lock matrix, we obtained the integration measurement by computing the largest subcomponent, that is, by applying the global integration measurement (Deco et al., 2015; Deco, Tagliazucchi, et al., 2017). Repeating the procedure for each driving event, we obtained the mean‐ignition and node‐metastability of the intrinsic‐driven integration for each brain region across the whole‐brain network. Figure adapted from Deco et al. (2019); Deco and Kringelbach (2017), and Escrichs et al. (2020).
