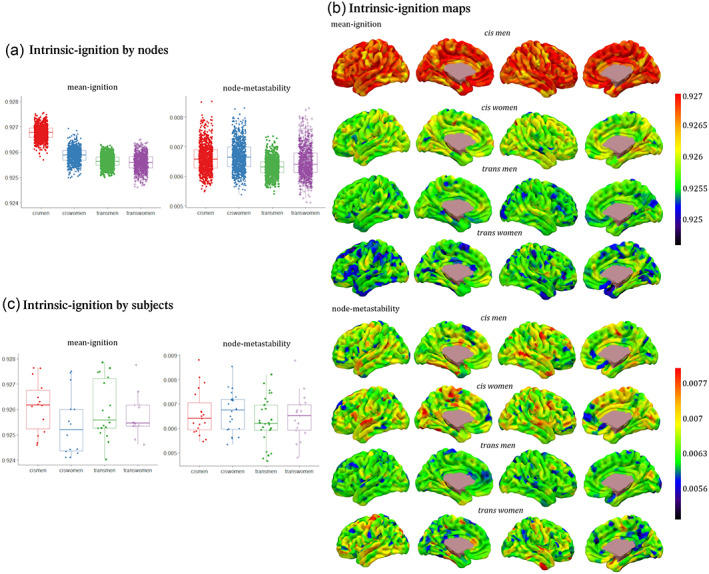
FIGURE 2.

Whole‐brain mean‐ignition and node‐metastability measurements for each of the 1000 brain regions by each group. (a) The boxes in the plots indicate the second and third quartiles (IQR), and middle lines are medians. Each dot represents a brain region. Means and standard deviations can be found in Table 1. There were significant differences between all groups' contrasts with Monte Carlo 1000 permutations and the Bonferroni correction p < .0004. (b) Brain renderings show the distribution of mean‐ignition and node‐metastability values per each brain region by group. Red warm regions had the highest mean‐ignition and node‐metastability values, and dark blue ones the lowest. (c) Mean‐ignition and node‐metastability measurements with averaged regions for each participant by groups. Each dot represents a participant. No group comparison reached the significance threshold after the Bonferroni correction. Metadata can be downloaded at https://doi.org/10.6084/m9.figshare.14622564.
