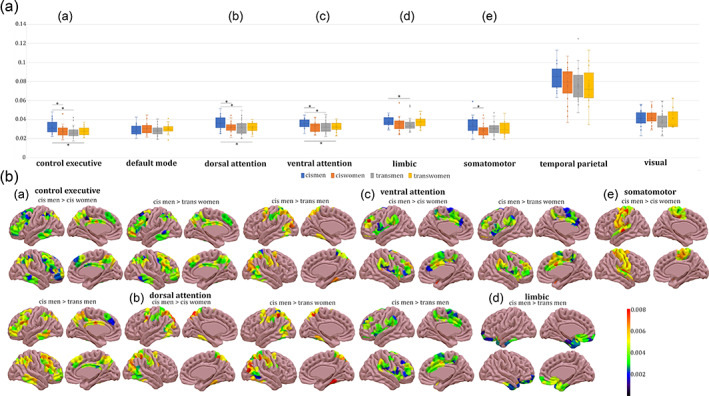
FIGURE 4.

Node‐metastability measurements by network. (a) Group node‐metastability values by network. The boxes in the plots indicate the second and third quartiles (IQR), middle lines are node‐metastability medians, and X are node‐metastability means. Legend: *p ≤ .05; **p < .01. (b) Rendered brains depict the node‐metastability difference between groups and were plotted with the SurfIce software. There were group differences in the (A) executive control, (B) dorsal attention, (C) ventral attention, (D) limbic, and (E) somatomotor networks. Metadata can be downloaded at https://doi.org/10.6084/m9.figshare.14622564.
