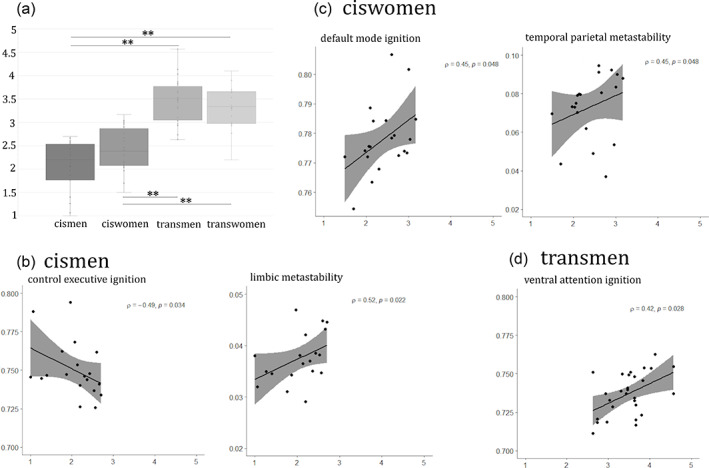
FIGURE 5.

Correlations between network‐based mean‐ignition and node‐metastability measurements and body image satisfaction scores. (a) Group comparisons of the body image scale scores. A general linear model with 1000 permutation testing and Bonferroni correction was applied. The boxes in the plots indicate the second and third quartiles (IQR), middle lines are total body image scores medians, and X are the means. Legend: * p ≤ .05; ** p < .01. Correlations within (b) the cis men group, (c) the cis women, and (d) the trans men. There were no significant correlations within the trans women group. Correlations are Spearman's ρ and shadowed areas are 95% confidence interval.
