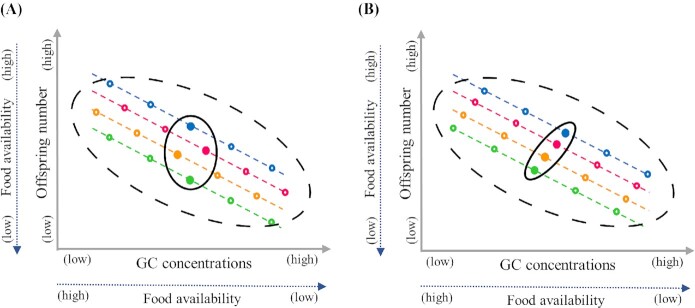
Fig. 3.
Exemplified relationships between individual variation in circulating GC concentrations (x-axis) and a fitness proxy (i.e., offspring number, y-axis), as well as their mutual dependence on an environmental gradient (food availability); inspired by Niemelä and Dingemanse 2018 and Bonier and Martin (2016). Colored circles indicate observations of the two traits for four individuals (represented by different colors) that were sampled five times along the gradient of decreasing food availability. Filled circles indicate average traits values of each individual. Population-level phenotypic correlations between the two traits (elliptic broken lines) embrace all the observations, while among-individual correlations embrace only average trait values (elliptic solid lines). Colored broken lines connect repeated measures for each individual. In both panels, when environmental conditions worsen, GC concentrations increase and offspring numbers decline. This mutual dependence of GCs and fitness on food availability drives the negative correlation observed at both the within-individual level and at the population-level. An among-individual correlation is absent in panel A, while it is present in panel B, but in an opposite direction to that observed at the within-individual and population level.

