Figure 1.
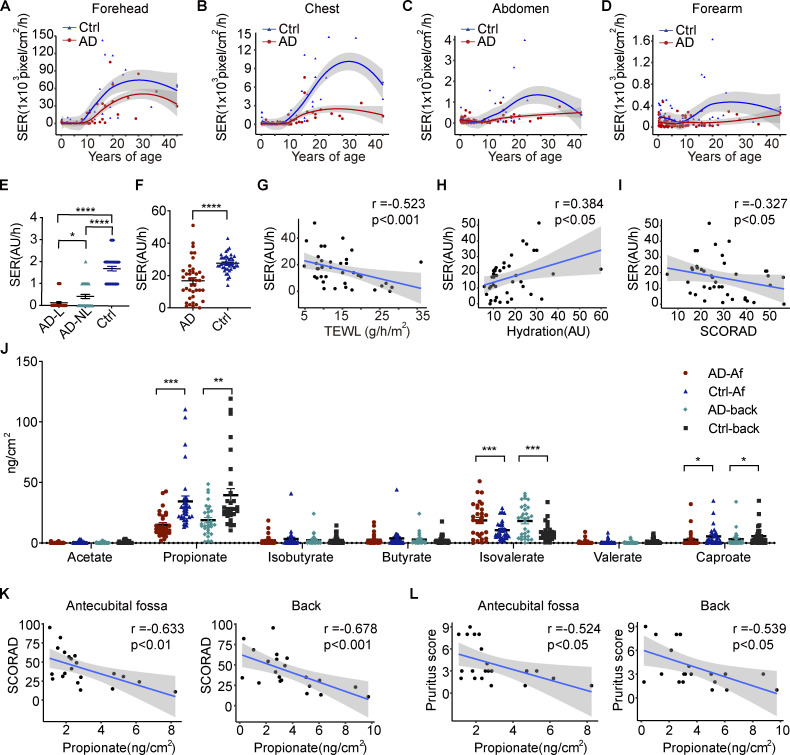
The production of sebum and microbial metabolites is decreased in the skin of AD patients. (A–D) SERs (pixels/cm2/h) measured using a Sebutape patch in nonlesional skin of different body sites of AD patients (n = 95) and healthy controls (n = 64) from different age groups. The solid lines represent LOESS fit lines. Gray shading around each line denotes 95% confidence intervals. (E) SERs (AU/h) measured by Delfin SebumScale in lesional (AD-L) and nonlesional (AD-NL) skin of AD patients and healthy individuals at the Af (n = 40 per group). (F) SERs (AU/h) measured by Delfin SebumScale in the nonlesional skin of forehead of AD patients and healthy controls (n = 40 per group). (G–I) Correlations between SERs and TEWL, epidermal hydration, and SCORAD of AD patients. The solid lines represent linear regression fit lines. Gray shading around each line denotes 95% confidence intervals. (J) SCFA levels on the nonlesional skin of the Af and the back of AD patients and healthy controls as measured by LC–MS/MS (n = 30 per group). (K) Correlations between the propionate level in the skin of Af/back and SCORAD of AD patients. (L) Correlations between the propionate level in the skin of Af/back and pruritus scores of AD patients. Data are expressed as means ± SEM. Statistical significance was analyzed by one-way ANOVA followed by Tukey’s test (E), unpaired t tests with Welch’s correction (F and J), and Spearman’s correlation test (G–I, K, and L). *, P < 0.05; **, P < 0.01; ***, P < 0.001; ****, P < 0.0001.

