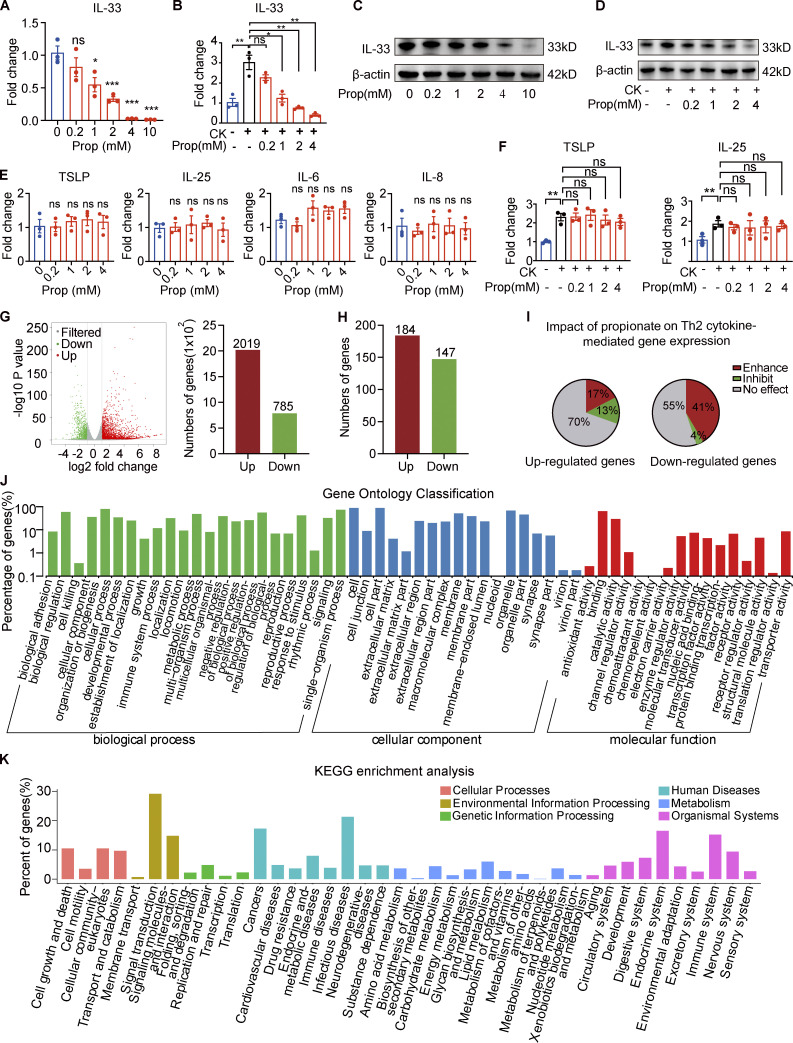
Figure 3.
Propionate inhibits IL-33 production in keratinocytes. (A) RT-qPCR showing the expression of IL-33 mRNA in cultured human primary keratinocytes incubated with different concentrations of propionate for 24 h (n = 3 per group). (B) RT-qPCR showing the expression of IL-33 mRNA in cultured human primary keratinocytes stimulated with IL-4 (100 ng/ml) and IL-1α (10 ng/ml) for 1 h and then cocultured with different concentrations of propionate for 24 h (n = 3 per group). CK (cytokine) represents 100 ng/ml IL-4 + 10 ng/ml IL-1α. (C) Western blotting showing the protein expression of IL-33 in cultured human primary keratinocytes treated with different concentrations of propionate. (D) Western blotting showing the protein expression of IL-33 in keratinocytes cultured under Th2 inflammatory conditions and treated with different concentrations of propionate. (E) RT-qPCR showing the mRNA expression of inflammatory cytokines in human primary keratinocytes incubated with different concentrations of propionate (n = 3 per group). (F) RT-qPCR showing the mRNA expression of inflammatory cytokines in keratinocytes cultured under Th2 inflammatory conditions and treated with different concentrations of propionate (n = 3 per group). (G) Volcano plots and histogram showing the DEGs (|fold-change| >2 versus control, P < 0.05) in keratinocytes treated with propionate. (H) DEGs (|fold-change| >2 versus control, P < 0.05) in keratinocytes stimulated with Th2 cytokines. (I) The effects of propionate treatment on gene sets modulated by Th2 cytokines (enhancement: fold-change >1.5 with propionate + Th2 cytokines versus vehicle + Th2 cytokines; inhibition: fold-change <−1.5 with propionate + Th2 cytokines versus vehicle + Th2 cytokines; no effect: −1.5< fold-change <1.5). (J and K) Gene Ontology analysis and KEGG enrichment analysis of the Th2 cytokine-induced genes in keratinocytes after propionate treatment. Data are representative of three independent experiments and are expressed as means ± SEM. Statistical significance was analyzed by one-way ANOVA followed by Dunnett’s test. *, P < 0.05; **, P < 0.01; ***, P < 0.001. Source data are available for this figure: SourceData F3.

