Figure 5.
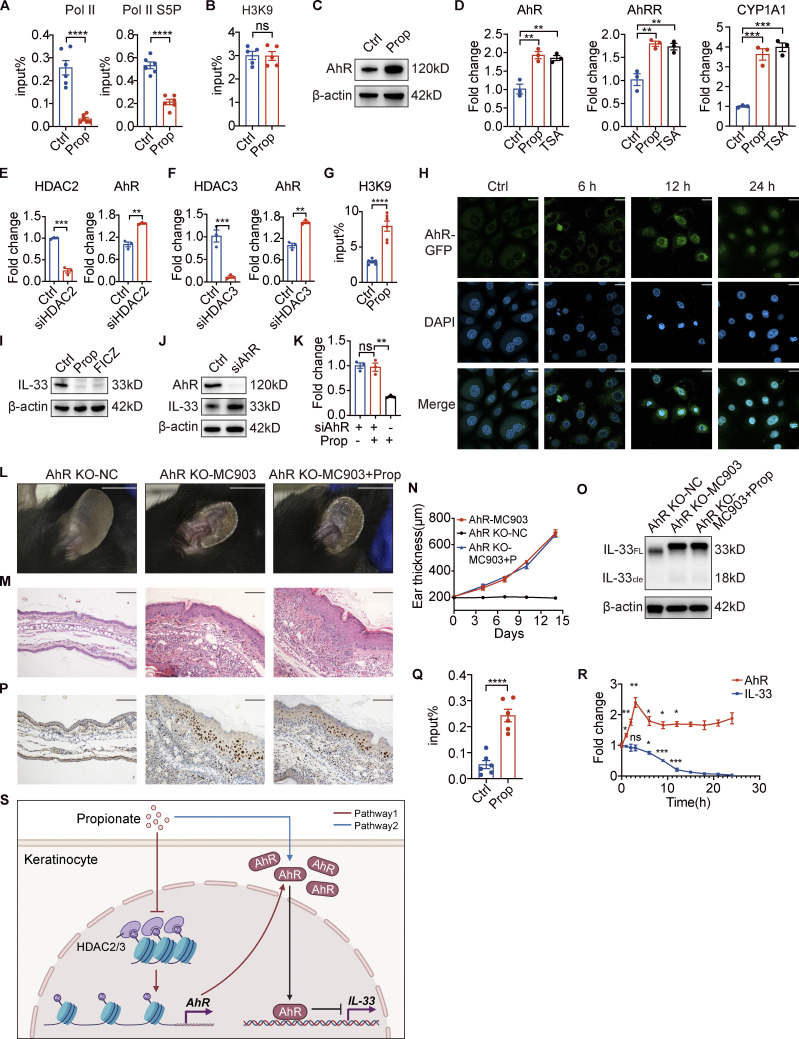
Propionate induces an increase in AhR expression and facilitates its recruitment to the IL-33 promoter. (A) A ChIP assay was used to assess the recruitment levels of polymerase II (Pol II) and its serine 5-phosphorylated form (Pol II S5P) to the IL-33 promoter in keratinocytes treated with propionate (Prop; n = 6 per group). (B) The levels of histone 3 lysine 9 acetylation (H3K9Ac) in the IL-33 promoter in keratinocytes treated with propionate as determined using a ChIP assay (n = 6 per group). (C) Western blotting of the protein expression of AhR in keratinocytes treated with propionate. (D) RT-qPCR analysis of the mRNA expression of AhR, AhRR, and CYP1A1 in keratinocytes treated with propionate or TSA (n = 3 per group). (E and F) RT-qPCR analysis of AhR mRNA expression levels in keratinocytes treated with siRNA specific for HDAC2 or HDAC3 (n = 3 per group). (G) A ChIP assay was used to measure the levels of H3K9Ac at the AhR promoter in keratinocytes treated with propionate (n = 6 per group). (H) Representative confocal images showing the localization of AhR in keratinocytes treated with propionate for different durations. (I) Western blotting analysis of the protein expression of IL-33 in keratinocytes treated with propionate or 6-formylindolo[3,2-b] carbazole (FICZ). (J) Western blotting analysis of the protein expression of IL-33 in keratinocytes treated with AhR-specific siRNA. (K) RT-qPCR analysis of IL-33 mRNA expression in keratinocytes treated with or without propionate when AhR was specifically silenced (n = 3 per group). (L–P) AhR KO mice with MC903-induced AD-like dermatitis were topically treated with propionate (n = 3 per group). Gross appearance (L), H&E staining of ear sections on day 14 (M), dynamic changes in ear thickness (N), Western blotting for IL-33 protein expression (O), and immunohistochemical staining of IL-33 in ear sections (P) are shown. (Q) The levels of AhR recruitment to the IL-33 promoter in keratinocytes following propionate treatment were assessed by ChIP assay (n = 6 per group). (R) RT-qPCR analysis of AhR and IL-33 mRNA levels in keratinocytes treated with propionate at different times (n = 3 per group). (S) A schematic figure showing the pathway through which propionate regulates IL-33. Pathway 1 (the red lines) reflects that propionate increases AhR expression by inhibiting HDAC2/3. Pathway 2 (the blue line) reflects that propionate induces AhR nuclear translocation. The black lines reflect that increased recruitment of AhR on the IL-33 promoter leads to IL-33 transcriptional repression. The schematic figure was created with BioRender.com. Scale bar = 20 μm (H); 1 cm (L); 100 μm (M and P). Data are representative of three independent experiments and are expressed as means ± SEM. Statistical significance was analyzed using unpaired t tests (A, B, E–G, and Q) and one-way ANOVA followed by Dunnett’s test (D, K, and R). *, P < 0.05; **, P < 0.01; ***, P < 0.001; ****, P < 0.0001. Source data are available for this figure: SourceData F5.

