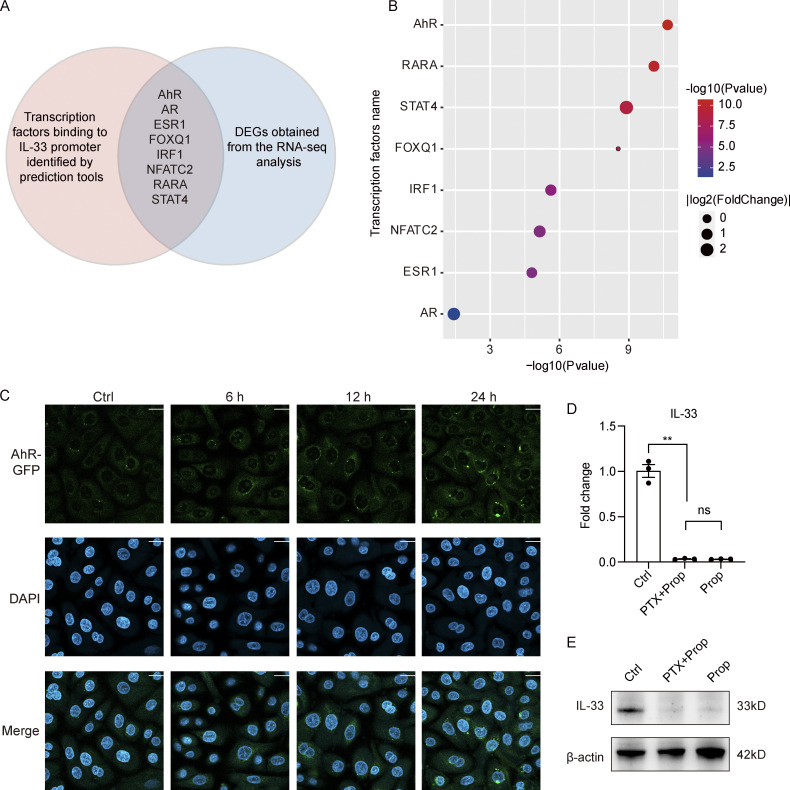
Figure S5.
Mechanism for the inhibitory effect of propionate on IL-33 expression. (A and B) Analysis of potential transcription factors binding to IL-33 promoter. (A) The Venn diagram of intersection between transcription factors predicted to bind IL-33 promoter and DEGs obtained from the RNA-seq analysis. The red circle represents transcription factors predicted by PROMO database (http://alggen.lsi.upc.es/cgi-bin/promo_v3/promo/promoinit.cgi?dirDB=TF_8.3) and further verified by the online software LASAGNA-search 2.0 (https://biogrid-lasagna.engr.uconn.edu/lasagna_search/). The blue circle represents DEGs (|fold-change| >1.5 versus control, P < 0.05) obtained from the RNA-seq analysis. The intersection lists transcription factors that exist in both circles. (B) The bubble chart showing P values and fold-change of the listed transcription factors. (C) Representative confocal images showing the localization of AhR in keratinocytes treated with CH-223191 for 1 h before stimulation with propionate (4 mM) for different times. Scale bar = 20 μm. (D and E) Keratinocytes were treated with PTX (0.2 μg/ml) for 1 h before stimulation with propionate (Prop; 4 mM) for 24 h. Results of RT-qPCR analysis (D) and Western blotting analysis (E) for the expression of IL-33 in keratinocytes are shown. Data are representative of three independent experiments and are expressed as means ± SEM. Statistical significance was analyzed by one-way ANOVA followed by Tukey’s test. **, P < 0.01. Source data are available for this figure: SourceData FS5.

