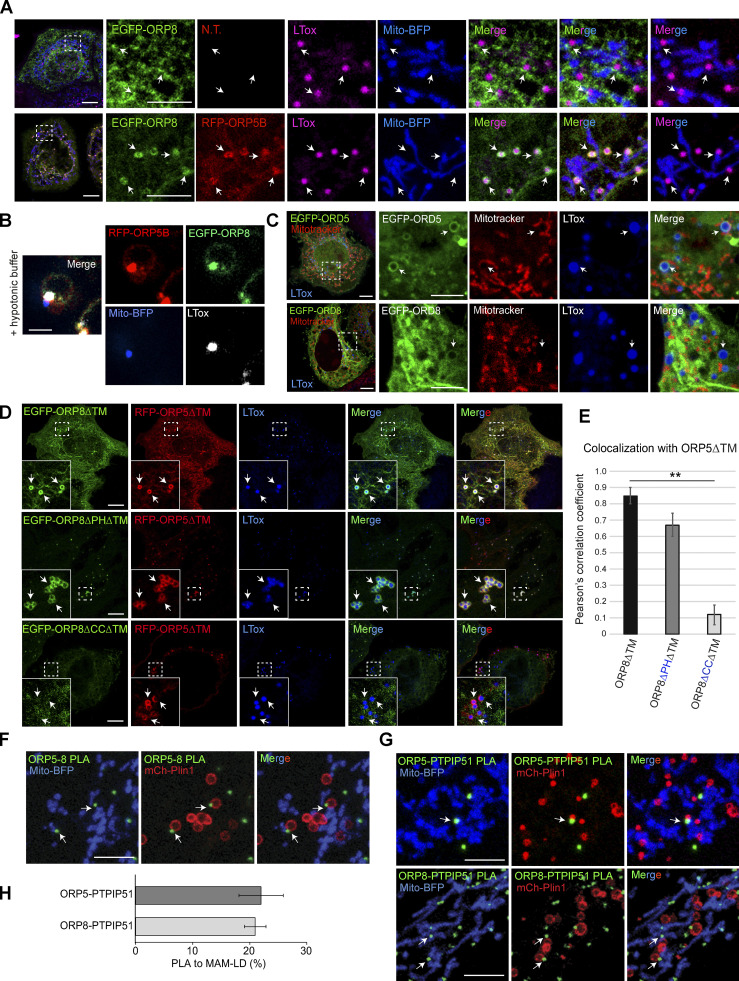
Figure 2.
ORP8 localizes and interacts with ORP5 at MAM-LD contacts. (A) Representative confocal images showing localization of EGFP-ORP8 alone (green) or together with RFP-ORP5B (red) in HeLa cells co-expressing Mito-BFP (blue) and treated with OA for 2 h and stained with LTox Deep Red (purple). Each image represents a single focal plane of confocal 3D stacks. Arrows point to ORP5-labeled MAM associated with mitochondria and LD (MAM-LD contacts). Scale bar, 10 μm (entire cell) or 5 μm (zoom). (B) Zoomed confocal images showing the co-localization of ORP5, ORP8, LD, and mitochondria in swollen Huh7 cells expressing RFP-ORP5B, EGFP-ORP8, and Mito-BFP. Scale bar, 3 μm. (C) Confocal images showing the localization of EGFP-ORD5 and EGFP-ORD8 (green) in HeLa cells treated with OA for 2 h and stained with Mitotracker (red) and LTox Deep Red (blue). Each image represents a single focal plane. Scale bar, 10 μm (entire cell), or 5 μm (zoom). (D) HeLa cells co-expressing EGFP-ORP8ΔTM (green) and RFP-ORP5ΔTM (red), EGFP-ORP8ΔPHΔTM (green) and RFP-ORP5ΔTM (red), or EGFP-ORP8ΔCCΔTM (green) and RFP-ORP5ΔTM (red). Each image represents a single focal plane of confocal 3D stacks. Arrows point to ORP5 localization on the LD surface. Scale bar, 10 μm. (E) Quantitative analysis of the co-localization of either EGFP-ORP8ΔTM, EGFP-ORP8ΔPHΔTM or EGFP-ORP8ΔCCΔTM with RFP-ORP5ΔTM by Pearson’s correlation coefficient. Data represent mean ± SEM of n = 10 cells. **P < 0.001, unpaired student’s t test. (F and G) Confocal micrographs showing endogenous ORP5-ORP8, ORP5-PTPIP51, and ORP8-PTPIP51 PLA interactions (green dots) in regions of HeLa cells co-expressing Mito-BFP (blue) and mCherry-Plin1 (mCh-Plin1) and treated with 300 μM OA for 2 h. Arrows point to PLA dots associated to MAM–LD contacts. Images represents a single focal plane. Scale bar, 10 μm. (H) Quantification of endogenous ORP5-PTPIP51 and ORP8-PTPIP51 PLA interaction at MAM–LD contacts. Data is shown as % mean ± SEM of n = 36 cells (ORP5-PTPIP51) and n = 15 cells (ORP8-PTPIP51).

