Figure 3.
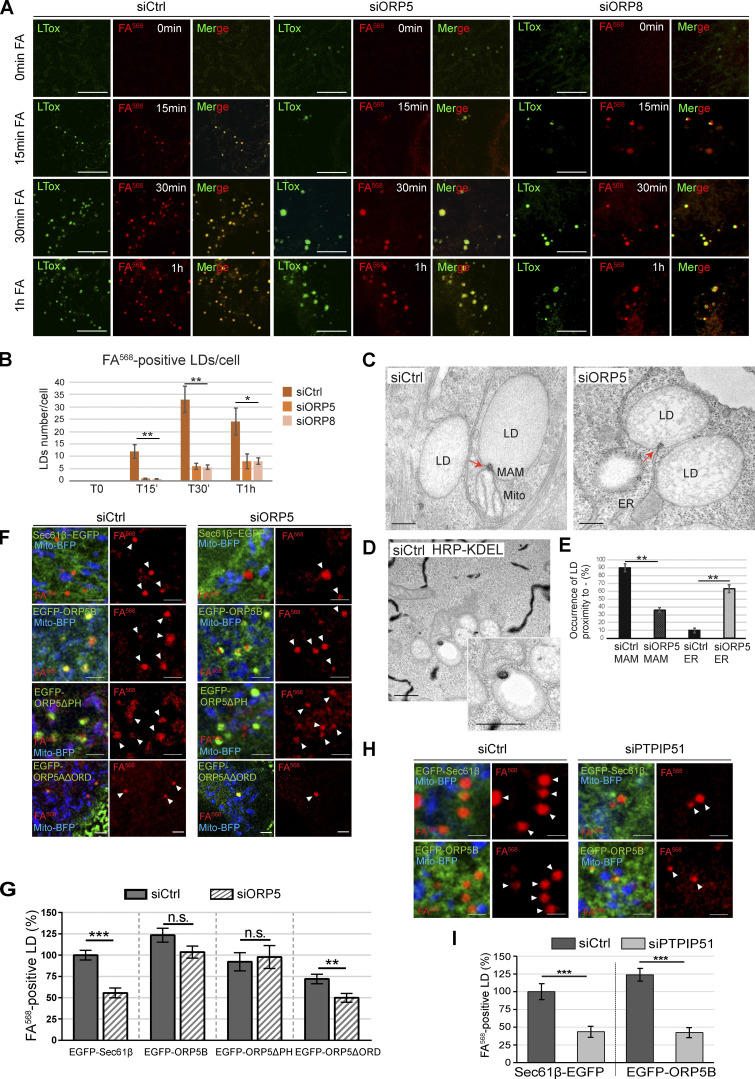
Depletion of ORP5 and ORP8 affect LD biogenesis. (A) LD biogenesis time-course. HeLa cells delipidated for 72 h were treated with siCtrl, siORP5, or siORP8, incubated with 1 μM FA568 (red) and stained with LTox Deep Red (green). Representative confocal images of regions of HeLa cells submitted to these experimental conditions at time 0 min, 15 min, 30 min and 1 h of FA568 incubation are displayed as a single focal plane. Scale bar, 5 μm. (B) Quantification of the number of FA568-positive LD in control, ORP5 and ORP8 knockdown HeLa cells at the indicated times. Data represent mean ± SEM of n = 30 cells. *P < 0.001, **P < 0.0001, unpaired two-tailed t test. (C) Representative electron micrographs of control and ORP5 knockdown HeLa cells, evidencing (red arrows) the electrondense structure that connects the nascent LD to the ER from which it originated and sometimes also to the mitochondria (Mito) at MAM–LD contacts. Scale bar, 250 nm. (D) Representative electron micrograph of HeLa cells expressing HRP-KDEL (black), showing that the electrondense structure shown on Fig. 3 C is MAM. Scale bar 500 nm. (E) Quantification of the number of LD associated with these ER or MAM electrondense structures. Data represent mean ± SEM of n = 20 cells. **P < 0.0001, unpaired two-tailed t test. (F) Confocal (single focal plane) micrographs of regions of control and ORP5 knockdown delipidated HeLa cells co-overexpressing Mito-BFP (blue) with Sec61β-EGFP (green), EGFP-ORP5B (green), EGFP-ORP5ΔPH (green), or EGFP-ORP5AΔORD (green). Arrowheads indicate the newly formed LD. Scale bar, 2 μm. (G) Quantitative analysis of the number of FA568-positive LD in control and ORP5 knockdown delipidated HeLa cells co-overexpressing Mito-BFP and Sec61β-EGFP, siRNA-resistant EGFP-ORP5B or EGFP-ORP5ΔPH, or EGFP-ORP5AΔORD, and treated for 15 or 30 min with FA568. Data are shown as % of mean ± SEM of n = 20–85 cells. ***P < 0.001, unpaired two-tailed t test. (H) Confocal (single focal plane) micrographs of regions of control and PTPIP51 knockdown delipidated HeLa cells, co-overexpressing Mito-BFP (blue) with Sec61β-EGFP (green) or EGFP-ORP5B (green) and treated for 1 h with FA568. Arrowheads indicate the newly formed LD. Scale bar, 1 μm. (I) Quantification of the number of FA568-positive LD in control and PTPIP51 knockdown delipidated HeLa cells co-overexpressing Mito-BFP and Sec61β-EGFP, or EGFP-ORP5B and treated for 1 h with FA568. Data are shown as % of mean ± SEM of n = 20–22 cells. ***P < 0.001, unpaired two-tailed ttest.

