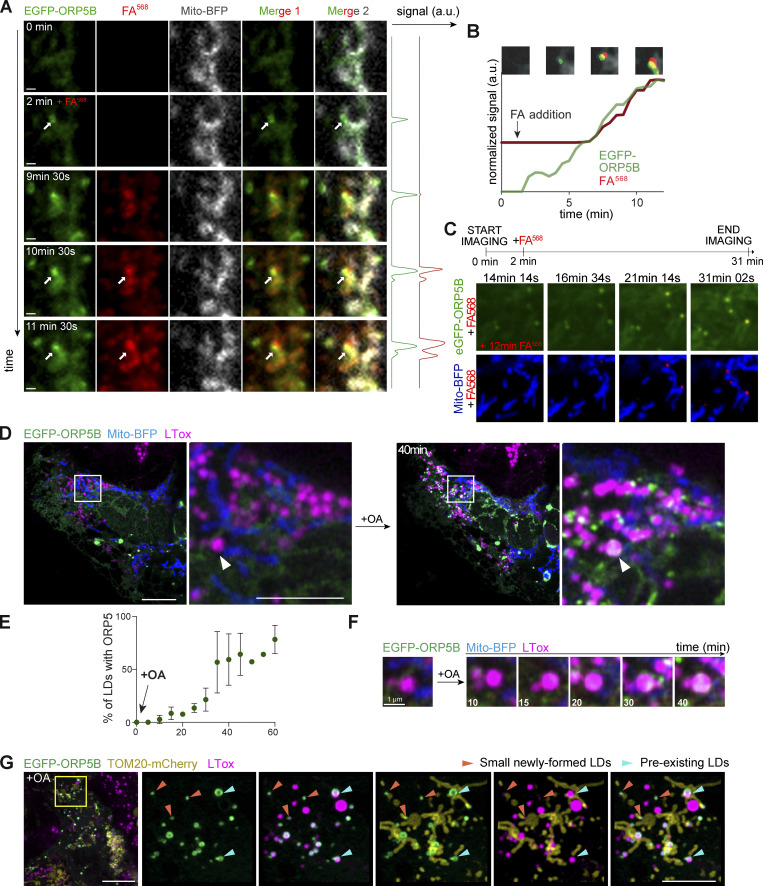
Figure 4.
ORP5 specifically localizes to ER subdomains where LDs originate and also to the preexisting lipid droplets. (A) Zoom of spinning video snapshots of HeLa cells expressing EGFP-ORP5B (green) and Mito-BFP (grey). After 2 min of acquisition, the cells were treated with FA568 (red) at 1 µM. Arrows indicate ORP5-labeled MAM-LD contacts associated to mitochondria. Scale bar, 1 µm. (B) Full time course analysis of the intensity changes for ORP5B (green) and FA568 (red) over time. (C) Additional spinning video snapshots of a region of HeLa cells expressing EGFP-ORP5B (green) and Mito-BFP (blue). After 2 min of acquisition, the cells were treated with FA568 at 1 µM. Arrows indicate ORP5-labeled MAM-LD contacts associated with mitochondria. Full cell view in Fig. S6 B. Scale bar, 1 µm. (D) Example of an Airyscan video snapshots of Huh7 cells expressing EGFP-ORP5B (green), RFP-Sec22b (red, shown in Fig. S3 A), and Mito-BFP (blue) before and after 40 min of 200 μM OA treatment. The lipid droplets were stained using LTox Deep Red (purple). Arrowheads indicate absence or presence of ORP5B at MAM-LD contacts before and after OA treatment, respectively. Full sequence in Fig. S3 A. Scale bar, 10 μm (entire cell), or 5 μm (zoom). (E) Quantification of the % of LDs with EGFP-ORP5 over the indicated time points. (F) Time course of ORP5 recruitment to a large pre-existing LDs depicted by the white arrowhead in the Huh7 cell in C. Scale bar, 1 µm. (G) Representative Airyscan snapshot of Huh7 cells expressing EGFP-ORP5B (green) and TOM20-mCherry (yellow), staining mitochondria, after 1 h 30 min of 200 μM OA treatment. The lipid droplets were stained using LTox Deep Red (purple). Scale bar, 10 μm (entire cell), or 5 μm (zoom). Orange arrowheads indicate small emerging LDs, light green arrowheads indicate pre-existing LDs.

