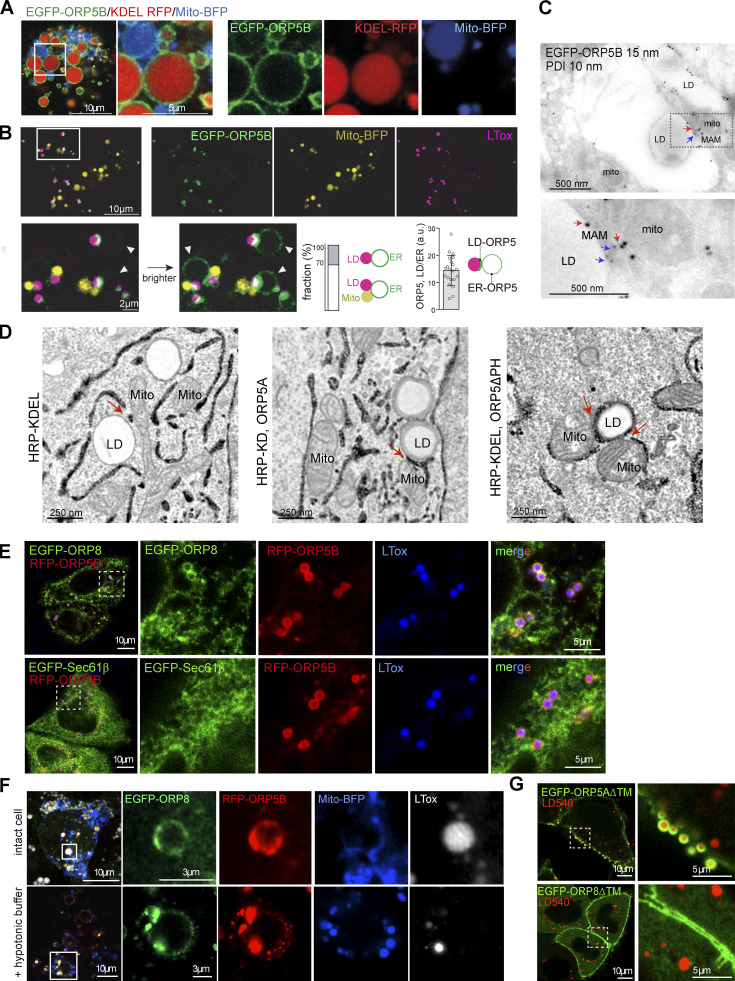
Figure S1.
ORP5 localizes to MAM subdomains in contact with LD. (A) Airyscan live imaging of swollen Huh7 cells co-expressing EGFP-ORP5B (green), Mito-BFP (blue) and KDEL-RFP (red). Scale bar, 10 μm (entire cell), or 5 μm (zoom). (B) Live imaging of EGFP-ORP5B (green), Mito-BFP (yellow) and LDs (purple) 10 min after swelling Huh7 cells. Zoom area is shown below, normal and enhanced EGFP-ORP5 signal to visualize its ER membrane signal (indicated by arrowheads). The bar graphs, from left to right, show (left) the percentage of ER–LD vs. ER–LD contacts events (n = 100) and (right) the signal ratio of EGFP-ORP5 intensity at the ER–LD contacts to the ER membrane (n = 20), as depicted by the illustrating image. Scale bar, 10 μm (entire cell), or 2 μm (zoom). (C) Electron micrograph of ultrathin cryosections of HeLa cells transfected with EGFP-ORP5B treated with OA for 2 h, and immunogold stained with anti-EGFP (15 nm gold) and anti PDI (ER marker). Red arrows indicate ORP5 gold particles localized to MAM-LD contacts. Blue arrows indicate PDI-labeled ER. Scale bar, 500 nm. (D) Electron micrographs of HeLa cells overexpressing HRP-KDEL alone or together with either EGFP-ORP5A (wt) or EGFP-ORP5ΔPH after OA treatment (300 μM for 2 h). Scale bar, 250 nm. (E) Representative confocal images (single focal plane) of HeLa cells co-expressing either EGFP-ORP8 or RFP-Sec61β (green) and RFP-ORP5B (red) and stained with LTox (blue). Scale bar 10 μm (entire cell), or 5 μm (zoom). (F) Representative confocal image (single plane) of control (intact cells) and swollen (+ hypotonic buffer) Huh7 cells co-expressing EGF-ORP8, RFP-ORP5 and Mito-BFP, and treated with LTox (white) to label LDs. (G) Confocal images (single focal plane) of HeLa cells expressing EGFP-ORP5A∆TM or EGFP-ORP8∆TM (green) and treated with LD450. Scale bar, 10 μm (entire cell), or 5 μm (zoom).

