Figure S2.
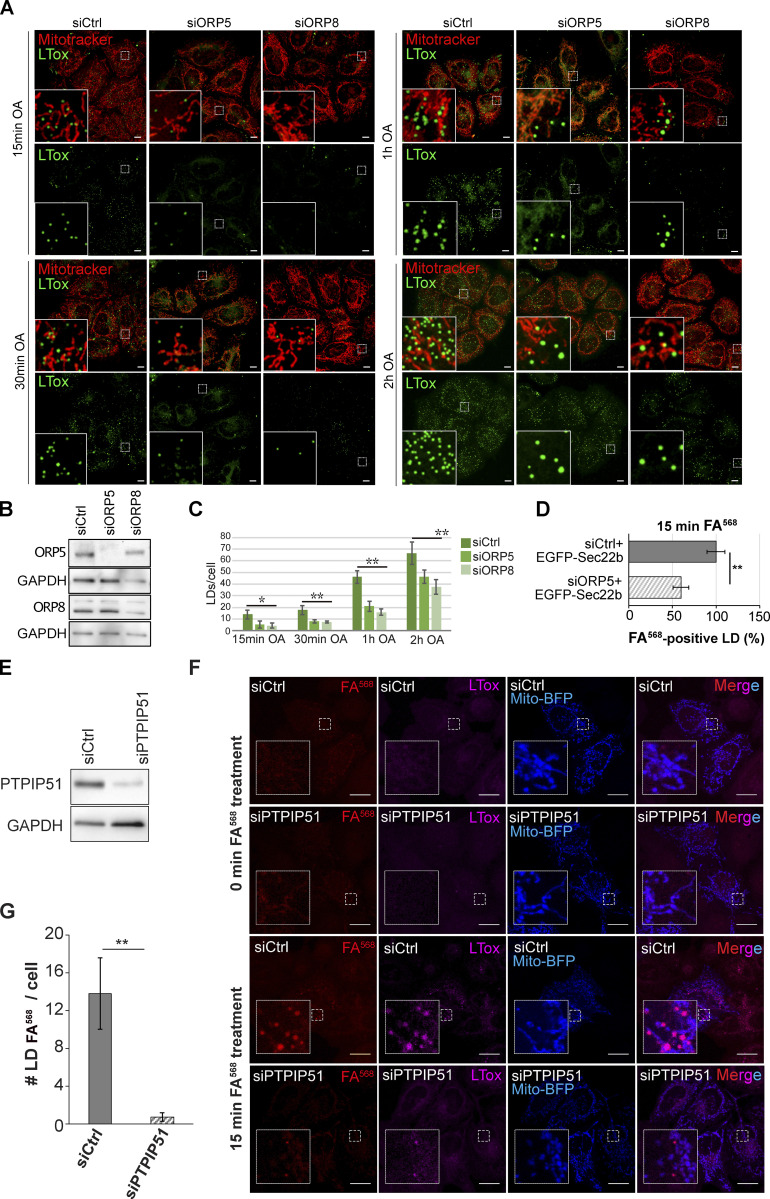
ORP5, ORP8 and PTPIP51 depletion impairs LD formation in HeLa cells. (A) LD biogenesis time-course. Confocal (single focal plane) images of control (siCtrl), and ORP5 (siORP5) or ORP8 (siORP8) siRNA-treated HeLa cells, delipidated for 72 h, and incubated with OA (300 μM) for 15 min, 30 min, 1 and 2 h. Cells were also stained with Mitotracker (red) and LTox (green). Scale bar, 10 μm. (B) WB analysis showing ORP5, ORP8 and GAPDH levels in protein lysates from Ctrl, ORP5 and ORP8 knockdown HeLa cells. (C) Quantification of the number of LTox-positive LDs in siCtrl, siORP5, or siORP8 cells in the indicated times after OA delivery. Data are shown as mean ± SEM of n = 30 cells. *P < 0.01, **P < 0.0001, unpaired two-tailed t test. (D) Analysis of FA568-positive LD in siCtrl and siORP5 HeLa cells, priorly delipidated for 72 h, and then co-transfected with Mito-BFP and EGFP-Sec22b. Data are show as % of siCtrl treated HeLa cells. n = 27 siCtrl and n = 24 siORP5. Bar indicated SEM. **P < 0.001, unpaired two-tailed t test. (E) Western blot analysis of the expression of PTPIP51 in siCtrl and siPTPIP51 HeLa cells, showing the efficiency of PTPIP51 knockdown. (F) Confocal (single focal plane) images of control (siCtrl) and PTPIP51 (siPTPIP51) siRNA-treated HeLa cells, delipidated for 72 h, and transfected with Mito-BFP (blue). Cells were treated with FA568 (1 μM) for 15 min, and stained with LTox (purple). Scale bar, 10 μm. (G) Analysis of the number of FA568-positive LDs in control and PTPIP51 knockdown cells. Data are show as mean ± SEM of n = 15 in siCtrl and n = 16 in siPTPIP51 cells. ***P < 0.001, unpaired two-tailed t test. Source data are available for this figure: SourceData FS2.

