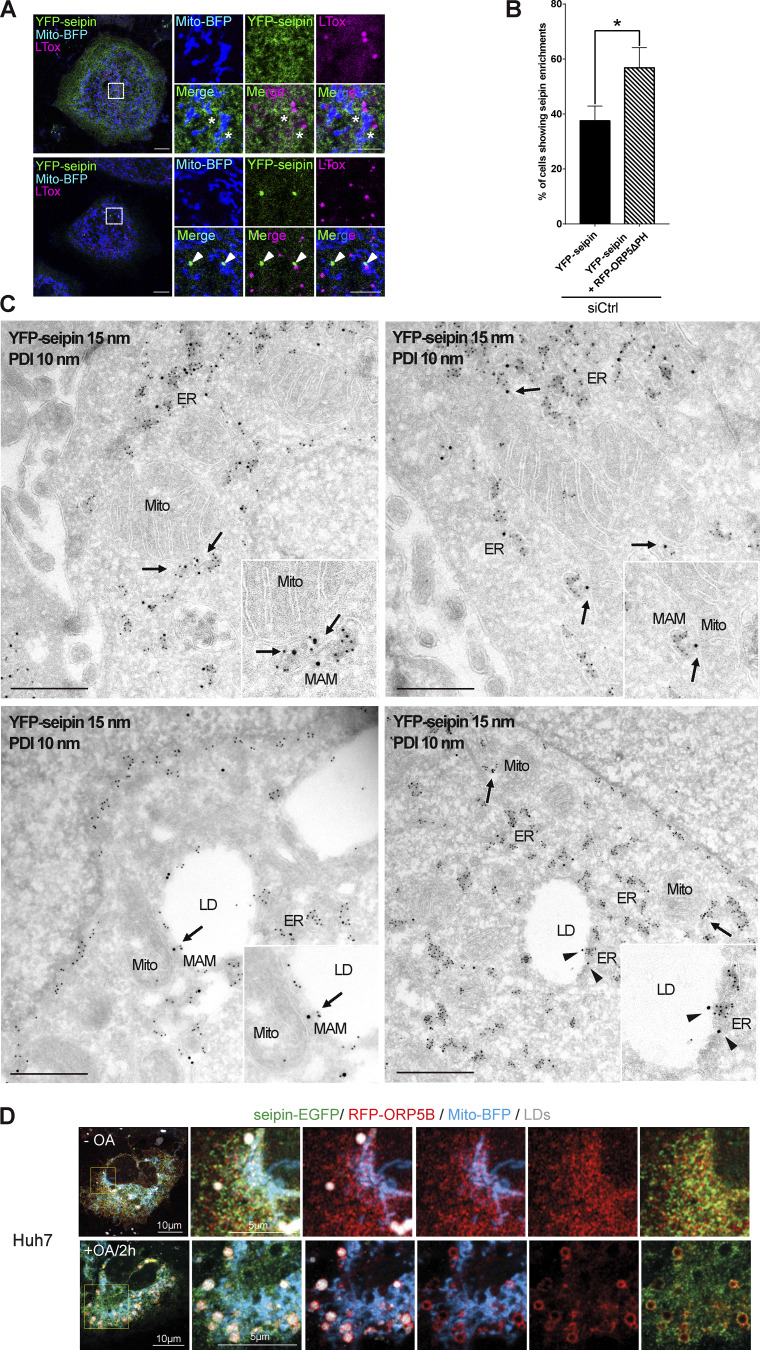
Figure S4.
ORP5 over-expression induces an increase of the localization of seipin to MAM-LD contact sites. (A) Confocal images (single focal plane) of HeLa cells expressing YFP-seipin (green) and Mito-BFP (blue). The LDs were stained LTox (purple). Upper panels show a cell with a reticular staining of seipin. Lower panels show a cell with enrichment of YFP-seipin in small “clusters.” Arrowheads show the enrichment of seipin in “clusters” closely opposed to MAM-LD contact sites. Asterisks show presence of seipin at MAM-LD contacts also in cells where it has a reticular distribution. Scale bar, 10 μm (entire cell) or 5 μm (zoom). (B) Quantification of the % of cells showing seipin enrichment at MAM-LD in cells expressing seipin alone or together with ORP5∆PH. Data are shown as % mean ± SEM of cells. n = 118 cells in siCtrl, n = 121 cells in siCtrl + RFP-ORP5∆PH. (C) Representative images of electron micrographs of ultrathin cryosections of HeLa cells transfected with YFP-seipin and immunogold stained with anti-GFP (15 nm gold) to detect seipin and anti-PDI (10 nm gold) to label the ER lumen. Arrows point the localization of seipin at MAM or MAM-LDs. Arrowheads point the localization of seipin at ER–LD contacts. Mito, mitochondria; ER, endoplasmic reticulum; MAM, mitochondria-associated membranes; LD, lipid droplets. Scale bar, 250 nm. (D) Confocal images (single focal plane) of Huh7 cells expressing seipin-EGFP (green), RFP-ORP5B (red) and Mito-BFP (blue) before and after 2 h of OA treatment. The LDs were stained with LTox (white). Scale bar, 10 μm (entire cell), or 5 μm (zoom).

