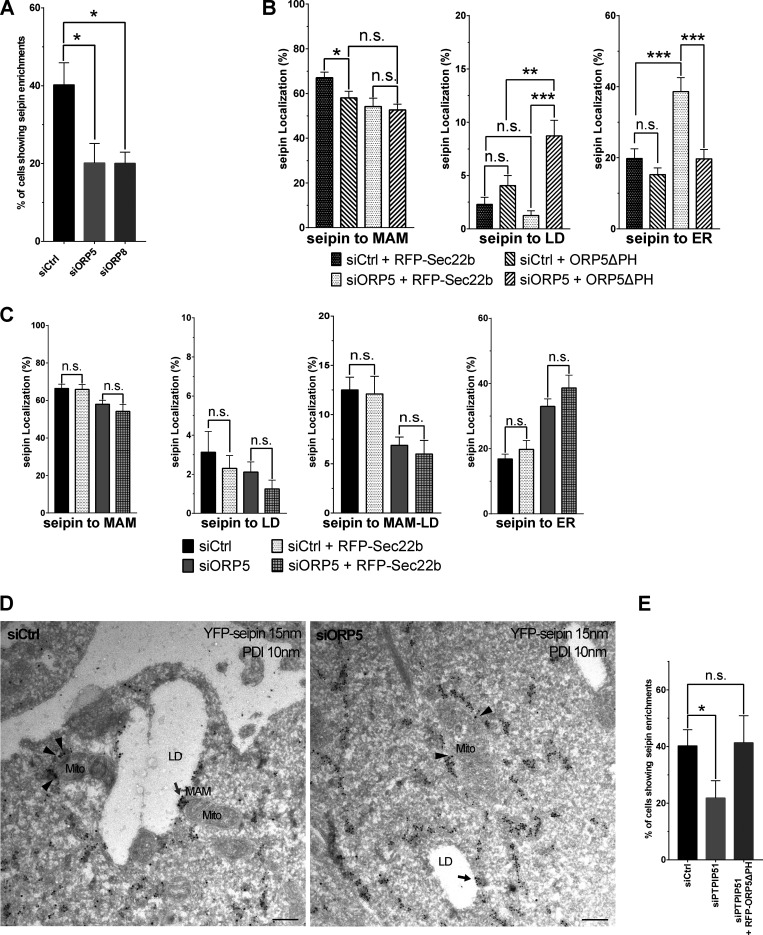
Figure S5.
ORP5 affects the localization of seipin in a ER-mitochondria contact sites integrity dependent way. (A) Quantification analysis of confocal data showing the percentage of YFP-seipin–expressing siCtrl or siORP5 or siORP8 cells displaying seipin enrichment at MAM-LD. Data are shown as % mean ± SEM of cell of n = 118 cells in siCtrl, n = 80 cells in siORP5 and n = 134 cells in siORP8. (B) Analysis of seipin localization to the indicated compartments (MAM = ER–Mito contacts, ER–LD = ER–LD contacts, ER = reticular ER) in siCtrl or siORP5 HeLa cells transfected with YFP-seipin and either RFP-Sec22b or siRNA-resistant ORP5∆PH. Data are shown as % mean ± SEM of cells. n = 14 cells in siCtrl + Sec22b, n = 17 cells in siORP5 + Sec22b, n = 41 cells in siCtrl + ORP5∆PH rescue and n = 19 cells in siORP5+ ORP5∆PH rescue (* = P < 0.05; ** = P < 0.01; *** = P < 0.001; Wilcoxon-Mann-Whitney test). (C) Quantitative analysis of the distribution of seipin enrichments in the indicated compartments (MAM = ER–Mito contacts, ER–LD = ER–LD contacts, MAM–LD = Mito–ER–LD contacts, ER = reticular ER) in HeLa cells treated with siCtrl or siORP5 and expressing YFP-seipin alone or together with RFP-Sec22b. Data are shown as % mean ± SEM of cell of n = 56 cells in siCtrl, n = 14 cells in siCtrl + Sec22b, n = 58 cells in siORP5 and n = 17 cells in siORP5 + Sec22b (n.s. = not significant; Wilcoxon-Mann-Whitney test). (D) Representative electron micrographs of ultrathin cryosections of HeLa cells transfected with YFP-seipin and immunogold stained with anti-GFP (15 nm gold) to detect seipin and anti-PDI (10 nm gold) to label the ER lumen. Arrows point to seipin localization at MAM–LD (red arrow) or ER–LD (black arrow). Arrowheads point to seipin localization at MAM. Mito, mitochondria; ER, endoplasmic reticulum; MAM, mitochondria-associated membranes; LD, lipid droplets. Scale bar, 250 nm. (E) Quantification of the % of siCtrl or siPTPIP51 cells transfected with YFP-seipin or of siPTPIP51 cells co-transfected with YFP-seipin and RFP-ORP5∆PH, showing seipin enrichment at MAM–LD. Data are shown as % mean ± SEM of cell of n = 118 cells in siCtrl, n = 91 cells in siPTPIP51, and n = 58 cells in siPTPIP51 + RFP-ORP5∆PH.

