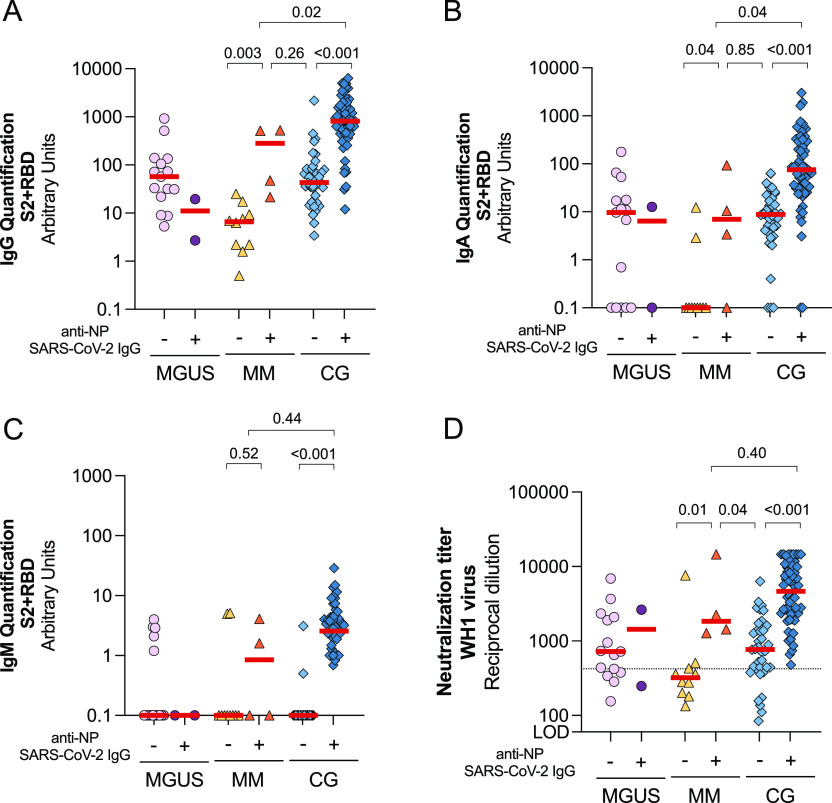
Figure 1. Comparison of humoral response between uninfected and infected individuals suffering from monoclonal gammopathies compared with a control group (CG).
(A, B, C) Levels of specific SARS-CoV-2 immunoglobulins IgG (Panel A), IgA (Panel B), and IgM (Panel C) against S2+RBD proteins quantified in plasma from uninfected and infected participants by ELISA after 3 mo from SARS-CoV-2 vaccination. Panel (D) Neutralizing activity against WH1 virus after 3 mo of vaccine administration in infected and uninfected participants. Dotted line indicates the 25th percentile of neutralization titer from CG. In all panels, median values are indicated and P-values were obtained from Mann–Whitney test for comparison between groups. Each symbol represents a participant, and are color-coding according to their disease group (MGUS, purple square; SMM, upper triangle turquoise; MM, lower triangle orange; and CG, blue diamond).
Source data are available for this figure.

